Approving an automation capital request from a single composite score can waste capital when hidden downtime, minor stops, or rejects originate outside the proposed machine. Within our factory automation capital planning framework, engineering and finance teams audit the underlying availability, performance, and quality records before requesting equipment quotes.
Overall Equipment Effectiveness (OEE) is calculated from three elements multiplied together: Availability Rate x Performance Rate x Quality Rate = OEE.
In the Lean Enterprise Institute OEE example, if Availability is 90%, Performance is 95%, and Quality is 99%, then 0.90 x 0.95 x 0.99 = 84.6% OEE.
NIST MEP recommends mapping out processes to identify and eliminate waste before considering automation, warning that if a process is not streamlined, automation could simply amplify those inefficiencies.
NIST MEP’s Getting Started checklist instructs manufacturers to link the initiative to financial performance, address a bottleneck or key pain point, use a systems approach rather than one-offs, and have a plan before getting a quote.
Core OEE Formulas and Time-State Records: Availability, Performance, and Quality
Separate the three component ratios and their underlying time and quantity counters before entering any capacity figures into a packaging line investment case.
| OEE component or framework | Grounded definition and formula |
|---|---|
| Core KPI ratio formulas | PMMI defines the three core OEE KPI formulas as Availability = Run Time / Planned Production Time, Performance = (Ideal Cycle Time x Total Count) / Run Time, and Quality = Good Count / Total Count. |
| Standardized time and quantity elements | ISO 22400 Part 2 (ISO 22400-2) defines 34 standardized KPIs and calculates the OEE index from Planned busy time (PBT), Actual production time (APT), Planned run time per item (PRI), Produced quantity (PQ), and Good quantity (GQ) as Availability (APT / PBT) x Effectiveness (PRI x PQ / APT) x Quality ratio (GQ / PQ). |
| Six major losses scope | OEE typically focuses on the six major losses: failures, adjustments, minor stoppages, reduced operating speeds, scrap, and rework. |
| Inline verification run | Universal Pack defines packaging equipment OEE as OEE = A x P x Q, where inline OEE verification during a machine run is related to 20 minutes of testing in line alongside Acceptance Quality Level (AQL) sampling. |
| Product correlation boundary | The term OEE was first mentioned in Seiichi Nakajima’s book ‘TPM Tenkai’ in 1982, and while performance of a particular product can be determined from OEE data, OEE cannot be calculated for an individual product unless all downtime (availability losses) is correlated to specific products. |
Worked Shift Calculation and Cycle-Time Audit Check
Check raw shift timestamps, break deductions, total counts, and reject counts directly against the ideal cycle time before accepting a baseline summary.
In OEE.com’s worked 8-hour (480-minute) shift calculation with 60 minutes of breaks (two 15-minute and one 30-minute break) and 47 minutes of downtime, Planned Production Time is 420 minutes, Run Time is 373 minutes, and Availability is 88.81% (373 / 420).
In OEE.com’s worked shift calculation with a 1.0-second Ideal Cycle Time, 373 minutes of Run Time, 19,271 total widgets, 423 reject widgets, and 18,848 good widgets, Performance is 86.11%, Quality is 97.80%, and overall shift OEE is 74.79% (0.8881 x 0.8611 x 0.9780).
OEE.com notes that Performance should never be greater than 100%, and if it is, that usually indicates that Ideal Cycle Time is set incorrectly (it is too high).
In Ruida Packing’s eight-hour blister and cartoning line example with 450 minutes of planned production time, 45 minutes of downtime, 405 minutes of run time, 200 blister packs per minute defined rate (81,000 expected packs), 72,900 total packs, and 71,442 good packs, Availability is 90%, Performance is 90%, Quality is 98%, and line OEE is 79.4%.
Why a Composite OEE Score Fails as a CapEx Justification
Reviewing a single headline ratio without factor decomposition can conceal opposing shifts between uptime and scrap or overlook unrecorded setup and root-cause gaps.
OEE.com demonstrates that a composite OEE score increasing from 85.1% in Week 1 (90.0% Availability, 95.0% Performance, 99.5% Quality) to 85.7% in Week 2 (95.0% Availability, 95.0% Performance, 95.0% Quality) hides a 4.5% decrease in Quality traded for a 5.0% increase in Availability.
According to the Flexographic Technical Association (FTA), monitoring individual KPIs such as waste, run time, downtime, or makeready in isolation can present false savings or ‘funny money’ because of the effect on other categories.
In FTA’s hypothetical press example, a makeready reduction project with a goal of 20 percent reported that makereadies improved by 25 percent after one month, but downtime was increased when the faster makeready solutions were applied.
In FTA’s shift example, 120 minutes of planned downtime (3 roll changes/hour at 5 minutes each x 8 hours) plus 32 minutes of unplanned downtime (20-minute ink blowout and 12-minute web break) equals 152 minutes of downtime across a 480-minute shift, yielding 68.3 percent Availability.
| Industry survey dimension | Grounded survey finding |
|---|---|
| Supplier OEE tracking offerings | In the PMMI Overall Equipment Effectiveness Quickie Survey of 35 respondents, almost half of respondents (45.7%) currently offer a solution to their customers that tracks OEE. |
| Most commonly tracked metrics | Among current OEE offerings in the PMMI survey, the most commonly tracked KPIs are downtime (93.8%), output (87.5%), and performance (87.5%). |
| Root-cause analysis gap | In the PMMI survey, 100.0% of respondents in the $100 - $249 Million revenue band and 60.0% in the $250 Million + band selected root cause analysis as an underserved OEE capability. |
| Changeover tracking gap | In the PMMI survey, 80.0% of respondents in the $20 - $49 Million revenue band and 66.7% in the $100 - $249 Million band selected changeover tracking as an underserved OEE capability. |
Decomposing the Six Big Losses into Equivalent Lost Shift Minutes
Convert every stop, speed reduction, and reject category into equivalent lost shift minutes so maintenance and operations teams can rank the actual capacity drain.
According to the Flexographic Technical Association (FTA), OEE came about in the 1960s, pioneered by Seiichi Nakajima, and must include the six key losses of planned and unplanned stops, minor stops and slow takt time, and production and start-up waste.
In The Lean Suite’s 480-minute shift example (two-minute rated cycle), converting the Six Big Losses into equivalent lost minutes yields 40 minutes of equipment failure, 35 minutes of setup/changeover, 28 minutes of minor stops, about 38 minutes from a 10% speed reduction across 377 run minutes, 24 minutes of process defects (12 parts), and 12 minutes of reduced yield (6 parts), totaling roughly 177 lost minutes and about 303 productive minutes (OEE near 63%).
OEE.com states that a plant reason-tracking policy may classify any downtime longer than two minutes as Equipment Failure (an Availability Loss), whereas Idling and Minor Stops (a Performance Loss) are typically a minute or two and well under five minutes, resolved by the operator.
The Lean Suite notes that a machine stopping for ninety seconds forty times a shift loses an hour of production that rarely appears on any maintenance report because operators seldom write down a stop lasting under a minute.
Ruida Packing states that a two-minute interruption repeated thirty times deserves more attention than one isolated twenty-minute stop, and cites the NJP-1500D automatic capsule filling machine (mold changes in about 15 minutes) as an example of repeatable modular tooling.
OEE.com defines Process Defects as defective parts (scrap and rework under First Pass Yield) produced during stable steady-state production, whereas Reduced Yield accounts for defective parts produced from startup until stable production is reached, most commonly tracked after changeovers.
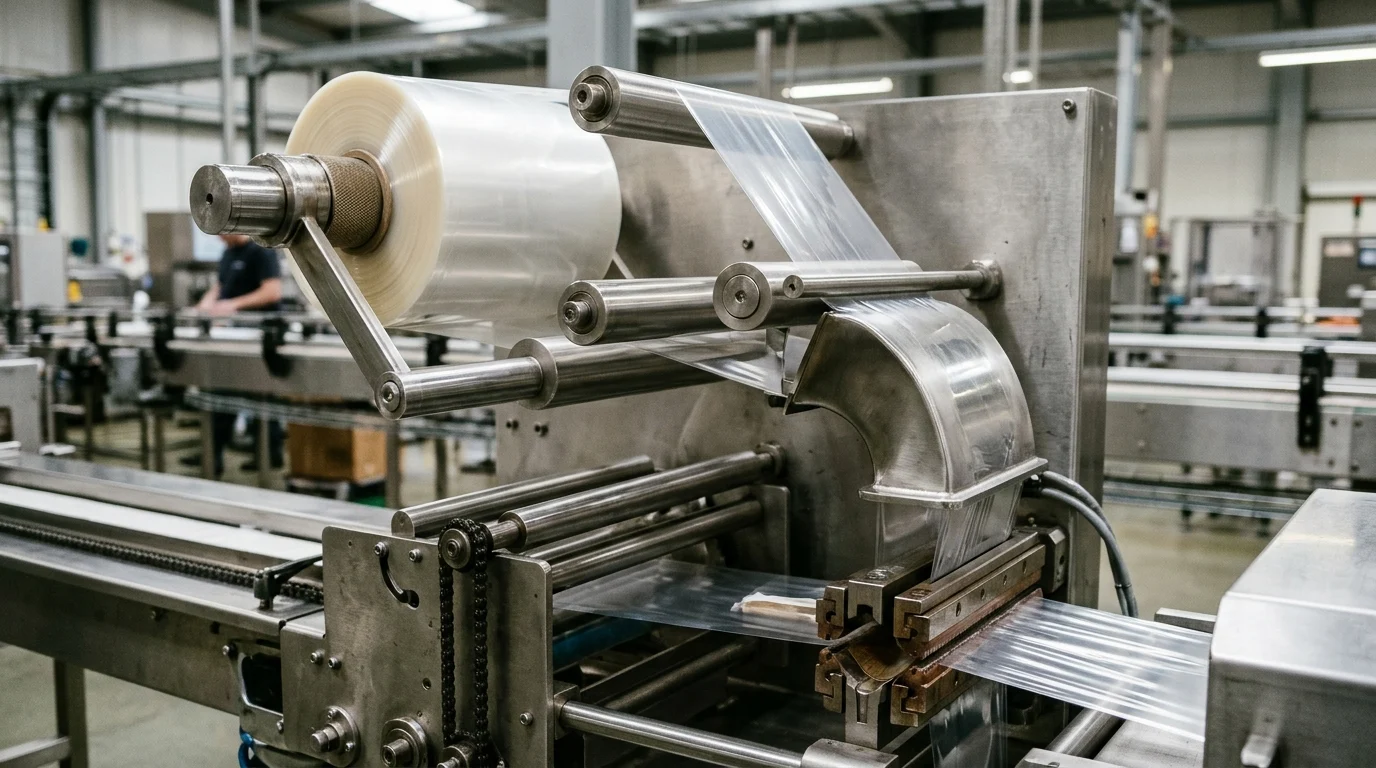
Inspect film path geometry, dosing transitions, and sealing jaw setup when short stops and startup rejects cluster at primary wrapping.
Material Feed, Dosing Transitions, and Sustainable Machine Speed
Verify whether stoppages and seal rejects stem from upstream dosing transitions, film sealing windows, or excessive running speed before specifying a higher-speed wrapper.
Rovema states that awkward transitions and other improper set-up/adjustment can lead to strung-out product, which is the leading cause of sealing problems.
Flow-wrapping film seal windows reported by Wolf Packing are 160–200°C for OPP films, 140–180°C for CPP, and 180–220°C for PET across film thicknesses of 20–100 microns (20–40 microns for speed; 60–100 microns for seal integrity).
Wolf Packing reports rated flow-wrapper speed ranges of 80–100 packages per minute (ppm) for semi-automatic wrappers, 60–80 ppm for entry-level automatics, 100–600 ppm for standard fully automatic machines, and 1,000–1,500 ppm for high-speed systems.
A PAC FW 350T flow wrapper handling products up to 9.75“ long achieves 60 ppm with a single jaw or 100 ppm with a twin jaw configuration, while maximum film width ranges from 12.5“ on smaller machines to 25.6“ on the SleekWrapper 65.
In a Wolf Packing 10-hour flow-wrapper comparison, one facility pushing maximum speed (projected 150,000 packages) produced 117,000 packages averaging 200 ppm due to stoppages, whereas a second facility running at 225 ppm produced 129,600 packages (12,600 more packages), supporting a sustainable pace 10–15% below rated capacity.
Packaging Line OEE Baseline Versus Single-Machine Metrics
Evaluate the connected packaging system from infeed to case packing and align station rates with our phased packaging line automation roadmap rather than buying an isolated high-speed unit.
Ruida Packing warns that machine OEE and production line OEE are not the same and that line OEE must never be calculated by averaging the OEE percentages of individual machines; instead, the line must be measured against its own planned time, defined rate, total output, and good output.
A PMMI survey respondent noted that OEE optimization is far more of a systems issue than a machine center issue because if one machine center in an integrated packaging line is not performing as specified, the entire packaging system is impacted.
Wolf Packing states that world-class OEE reaches 85% or higher while average manufacturers operate at 60% or less (a 25-point gap), and the machine with the lowest OEE breakdown score at any moment is the current bottleneck.
Syntegon notes that when production stops running smoothly, teams logically look first at where the process has stalled, but often the actual root cause lies elsewhere in the line.
On Manufacturing Capital Notes’ phased packaging line automation roadmap, Required good-pack rate = required good packs / (scheduled line minutes - planned unavailable minutes); in its worked hypothetical planning example, 12,000 good packs / (480 - 60) minutes = 28.6 good packs/minute across a 420-minute window, meaning an advertised 36 packs/minute upstream machine will not resolve a 26 good packs/minute downstream clearance limit.
Wolf Packing defines the line Balancing Delay formula as d = (nTc - Twc) / nTc (where n is workstations, Tc is cycle time, and Twc is total work content), recommends a 48-hour baseline period for consistent SKUs or a full production week for frequent changeovers, and specifies a minimum 30-minute acceptance run.
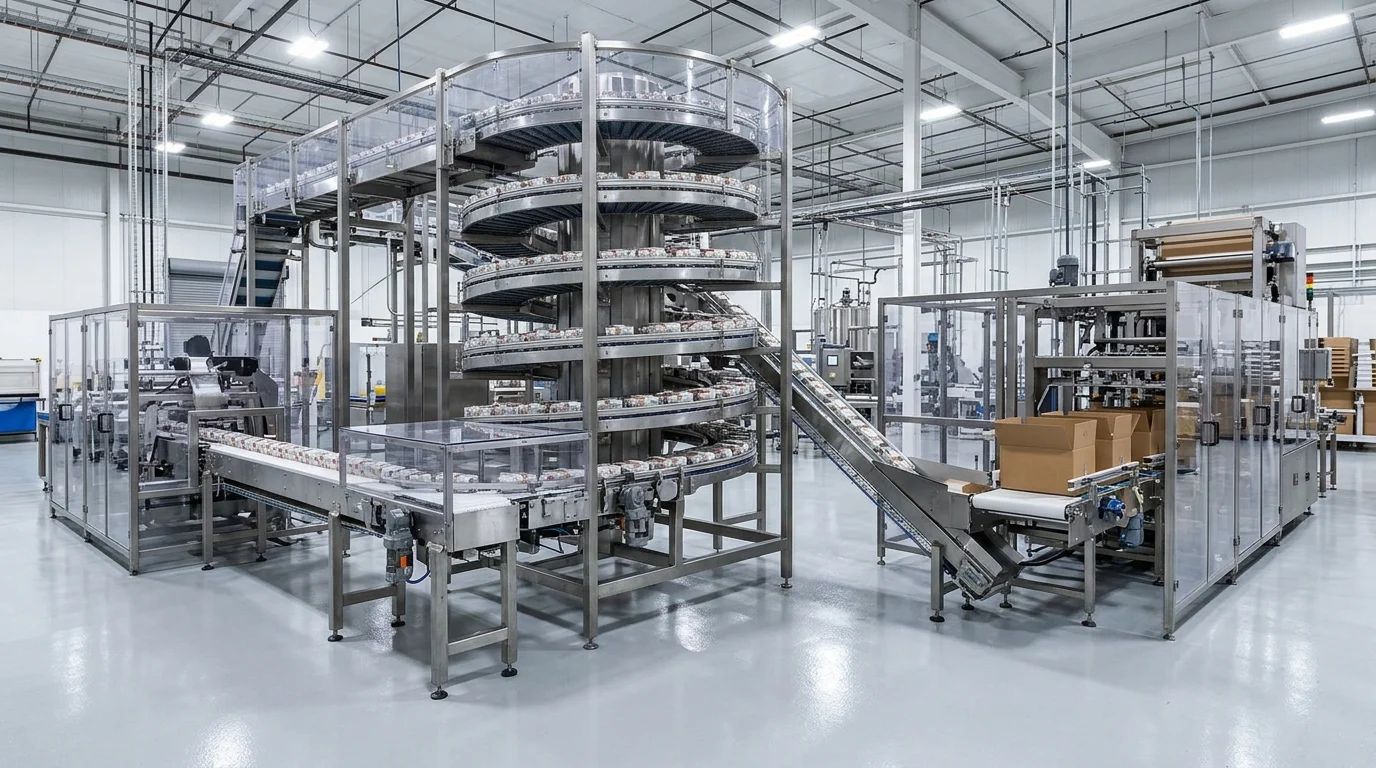
Separate upstream starvation from downstream blockage across transfer conveyors and accumulation buffers before sizing a replacement machine.
Accumulation Buffering and PackML State Tracking
Record upstream starvation, downstream blockage, and buffer capacity alongside machine fault states so inter-station delays are not misclassified as machine breakdowns.
Wolf Packing states that properly sized buffers can improve overall line efficiency by up to 11%, and buffer capacity should cover the longest anticipated upstream interruption plus a 20% margin.
On Syntegon neXt food packaging lines, the DRFG Gondola Buffer decouples process and packaging sections to protect overall output from isolated stops and stores up to 600 rows of products.
Syntegon states that HFX flow wrappers run for four hours or longer without operator intervention, while TRX integrated topload cartoners support changeovers within ten minutes.
A PMMI survey respondent stated that control code can be written in a PackML structure to make the code more OEE ready, and that machinery runtimes plus auxiliary equipment and materials that could produce bottlenecks or line stoppages are critical to monitor.
In Packaging Strategies’ PackML report, Matrix found that 10 percent more effort to introduce PackML allowed 90 percent of code to be reused and reduced lead times by 25-30 percent, while Axon cut debug testing time by 60 percent, reduced overall engineering and manufacturing time by 40 percent, and reduced start-up/testing time by 40 percent, with 80 percent reusable code.
Routing the OEE Baseline to Process Fixes, Retrofits, or New Equipment CapEx
Match the dominant loss category from the floor baseline to changeover reduction, technical line audits, a station retrofit versus replacement review, a legacy PLC and servo control upgrade, or a full capital request using our manufacturing equipment CapEx budget template and NPV versus simple payback guide.
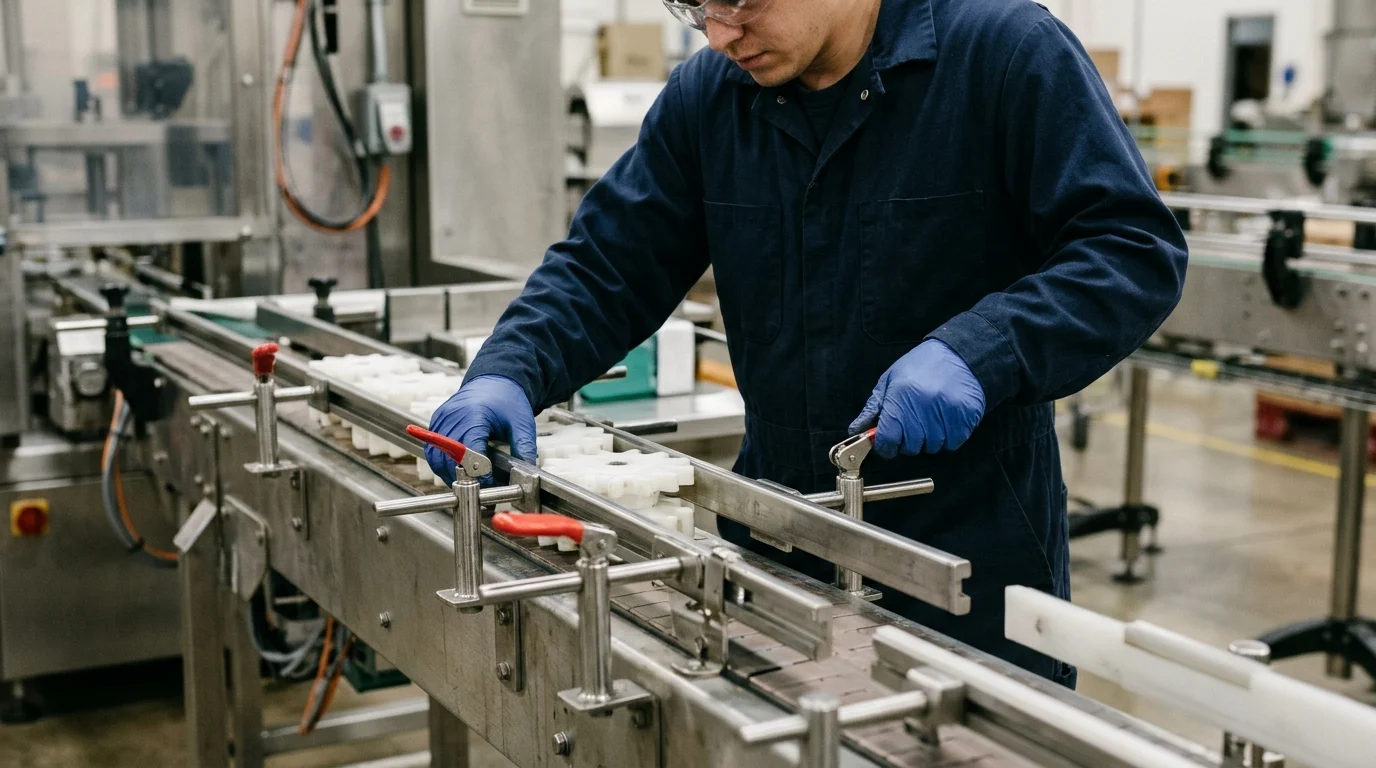
Audit changeover adjustments and modular format tooling before attributing planned setup time to running speed limits.
| Intervention path | Grounded engineering and financial case evidence |
|---|---|
| Changeover reduction (SMED) | In a Wolf Packing SMED case study, reducing changeover time by 88% from 80 minutes to 9 minutes per switch across three daily changeovers created 213 minutes (3.55 hours) of new production time, worth $7,100 in daily recovered capacity at $2,000 revenue per hour. |
| Material feed and filling audit | In a Syntegon technical audit of three liquid pharmaceutical lines where jams in the packaging material feed repeatedly caused short delays, resolving filling bottlenecks and primary packaging tilts/rotations increased output by ten percent. |
| Frequent alarm root-cause audit | In a six-month Syntegon Synexio customer project, using real-time insights to identify the causes of a frequent alarm that had been the main source of downtime and waste achieved a 75 percent reduction of the most frequent alarm. |
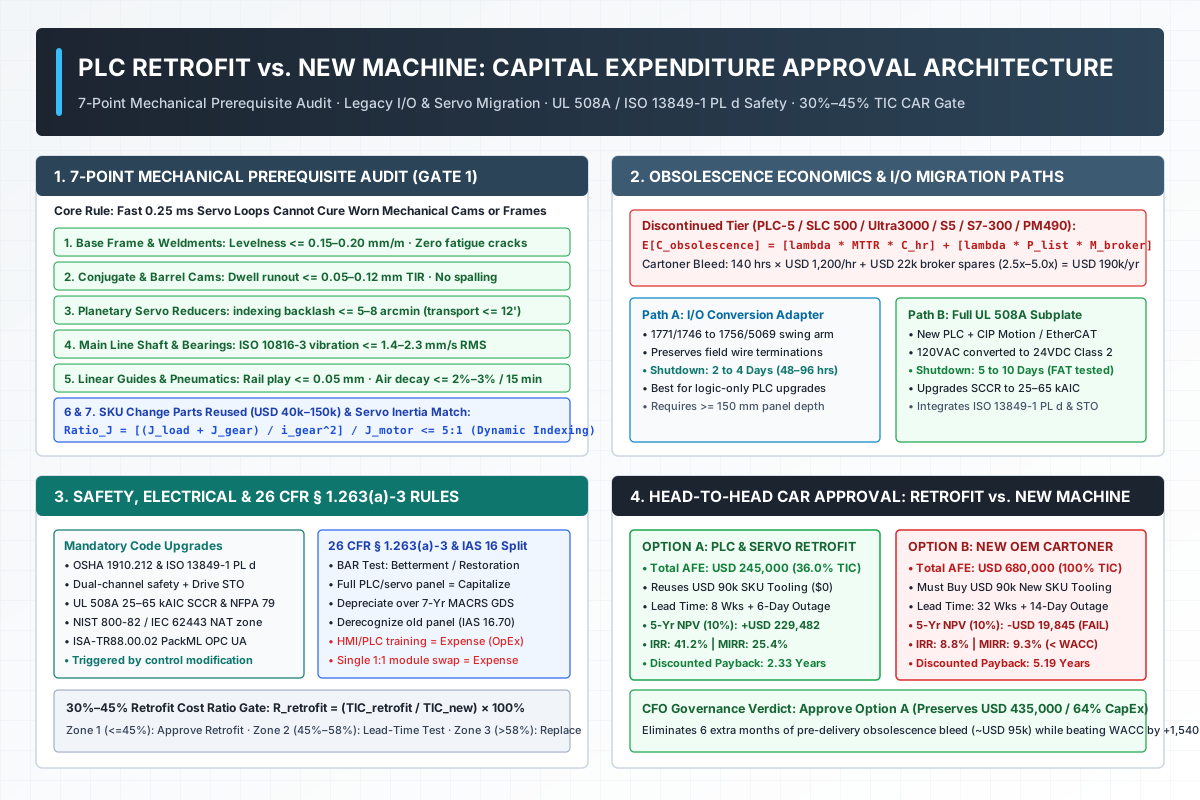
| Controls and servo retrofit gate | On Manufacturing Capital Notes’ retrofit-versus-replacement guide, when a station’s mechanical frame and cams are intact but its PLC and servo drives are discontinued, capital approval evaluates the 7-point mechanical audit, UL 508A / ISO 13849-1 PL d safety triggers, and the 30%–45% cost-ratio math. |
| Pre-automation feasibility study | In a Wisconsin MEP case study, a metalworking manufacturer invested $7,500 in a feasibility study and nearly six months of vendor search before making an initial $107,000 investment in one robotic welding cell. |
| Bottleneck cell automation | In a New Mexico MEP case study at Syzygy Tile Works, deploying a robot to relieve the bottleneck in the glazing operation resulted in cutting waste by 30 percent and increasing output by 20 percent. |
Pre-Automation CapEx OEE and Six Big Losses Field Data Collection Sheet
Complete this floor record sheet across the relevant product formats and attach it to the equipment procurement checklist and the packaging machinery factory acceptance test checklist before requesting capital sign-off.
| Audit record section | Observation to capture on the floor | Plant record entry |
|---|---|---|
| Line and station boundary | Primary machine identifier, upstream feeder, downstream packer, and discharge counting point | Record on shift sheet |
| Baseline window and schedule | Calendar shift length, scheduled breaks, preventive maintenance window, and active SKU format list | Record on shift sheet |
| Cycle time and rate basis | Defined cycle time per pack, target line rate, and verification that performance stays within valid bounds | Record on shift sheet |
| Stop-duration policy | Plant cutoff separating operator-cleared minor stops from maintenance-logged equipment failures | Record on shift sheet |
| Equipment failure log | Unplanned mechanical, electrical, or control faults with timestamps and root-cause station | Record on shift sheet |
| Setup and adjustment log | Format changeover duration from last good pack of prior SKU to first stable good pack of next SKU | Record on shift sheet |
| Idling and minor stop tally | Sensor jams, film registration slips, carton misfeeds, and transfer resets cleared by the operator | Record on shift sheet |
| Reduced speed log | Actual operating pace compared with defined cycle time and reasons for manual speed derating | Record on shift sheet |
| Steady-state process defects | Scrap and rework counts rejected during stable running by seal, weight, vision, or closure checks | Record on shift sheet |
| Startup yield loss | Defective packs produced during warm-up, web threading, and post-changeover stabilization | Record on shift sheet |
| Starvation and blockage log | Time spent waiting for upstream product delivery versus waiting for downstream case clearance | Record on shift sheet |
| Capital routing disposition | Engineering sign-off routing the baseline toward setup tooling, material specs, controls retrofit, or bottleneck CapEx | Record on shift sheet |
Sources
- Lean Enterprise Institute — Overall Equipment Effectiveness (OEE) Lexicon
- OEE.com (Vorne Industries) — Calculating OEE
- OEE.com (Vorne Industries) — OEE Six Big Losses
- Ruida Packing — Overall Equipment Effectiveness in Pharmaceutical Manufacturing
- Wolf Packing — Flow Wrap Machine Speeds: Matching Output to Upstream Equipment
- NIST MEP National Network — How to Plan for Successful Automation Implementation
- PMMI Business Intelligence — Overall Equipment Effectiveness Quickie Survey Results
- Fabrico.io — OEE and ISO 22400: How the Standard Defines Manufacturing KPIs
- Universal Pack — How to Calculate the Packaging Equipment Effectiveness?
- Wikipedia — Overall Equipment Effectiveness
- Flexographic Technical Association (FTA) — Overall Equipment Effectiveness in Manufacturing
- The Lean Suite — Six Big Losses That Reduce OEE in Manufacturing
- Rovema North America — High Accuracy Filling, Dosing & Weighing Equipment for VFFS Machines
- Syntegon — Synexio: Turn Production Data into Higher OEE
- Manufacturing Capital Notes — Packaging Line Automation: A Phased Roadmap for Capital Planning
- Syntegon — Future-Proof Automation in Food Packaging
- Packaging Strategies — How Four OEMs Implemented PackML
- Syntegon — Increasing OEE with Technical Audits
- Manufacturing Capital Notes — Questions That Differ When You Retrofit or Replace a Station