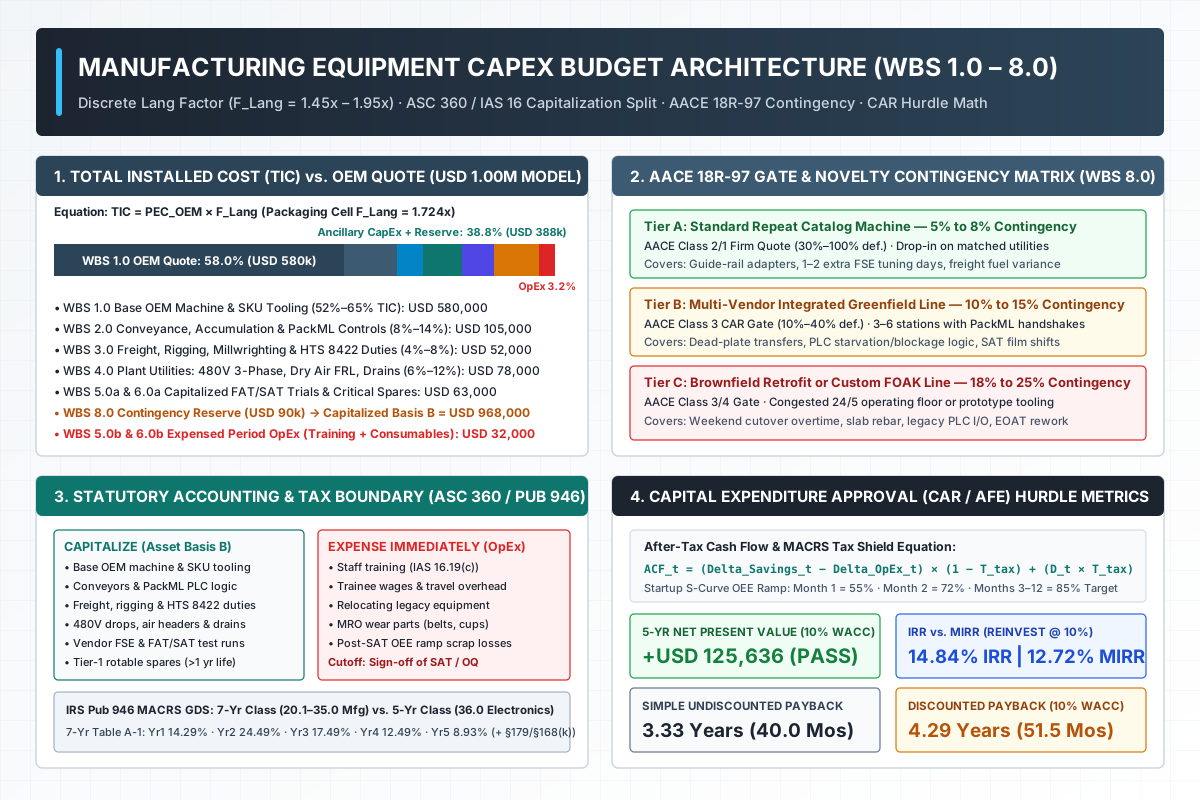
Submitting a Capital Appropriation Request (CAR) or Authorization for Expenditure (AFE) anchored only to an original equipment manufacturer (OEM) machine quotation causes a 30% to 90% project budget overrun and stalls capital expenditure approval once unbudgeted conveyor transfers, millwright rigging, 480V electrical drops, and sacrificial commissioning materials hit the plant ledger. On an industrial manufacturing cell or automated packaging line, bare OEM machinery (Purchased Equipment Cost, PEC, priced FOB factory) accounts for only 50% to 68% of Total Installed Cost (TIC), corresponding to a discrete manufacturing Lang Factor (F_Lang) of 1.45x to 1.95x. Structuring a bankable capex budget template requires decomposing total project outlay across an 8-Bucket Work Breakdown Structure (WBS 1.0 to WBS 8.0), separating capitalized fixed-asset basis (ASC 360-10-30 / IAS 16.16) from expensed period OpEx (IAS 16.19), sizing equipment capex contingency by AACE 18R-97 gate maturity and technical novelty (5%–8%, 10%–15%, or 18%–25%), and proving positive Net Present Value (NPV) and Modified Internal Rate of Return (MIRR) under a realistic 3-month S-Curve OEE Ramp-Up.
Where our introductory guide on how to write a packaging line investment case establishes the baseline hourly good-pack counting rules (1,200 attempted minus 40 rejected equals 1,160 good packs) and names the qualitative cost categories inside the capital planning workflow, this engineering and corporate-finance reference provides the complete quantitative WBS architecture, statutory tax and accounting boundaries, stage-gate contingency matrix, and discounted cash-flow equations required to build an audit-ready equipment budget.
| WBS Code & Cost Bucket | Share of Total Installed Cost (TIC) |
Markup on Base OEM Quote (PEC) |
Accounting & Tax Classification (ASC 360 / IAS 16 / IRS Pub 946) |
Dominant Budget Failure Mode & Engineering Prevention |
|---|---|---|---|---|
| WBS 1.0 — Base OEM Machinery & Format Tooling | 52% – 65% (58.0% in worked model) |
100.0% (Reference Base PEC) |
Capitalize (CapEx Basis B); 7-Yr MACRS GDS (Classes 20.1–35.0) or 5-Yr (Class 36.0) |
Assuming base brochure quote covers all plant SKUs; specify every extra SKU change-part set (USD 8,000–USD 35,000/set) and ISO 13849-1 PL d guarding before freezing URS |
| WBS 2.0 — Upstream/Downstream Conveyance & Line Integration | 8% – 14% (10.5% in model) |
+13% – +24% of PEC |
Capitalize (CapEx Basis B); depreciated with host line under ASC 360-10-30 |
Buying standalone machines with no integrator owner for ISA-TR88.00.02 PackML / OPC UA starvation/blockage handshakes or accumulation buffers |
| WBS 3.0 — Freight, Rigging, Millwrighting & Import Duties | 4% – 8% (5.2% in model) |
+7% – +14% of PEC |
Capitalize (CapEx Basis B) per IAS 16.16(a)–(b) & 26 CFR § 1.263(a)-2 |
Budgeting standard LTL freight when oversized frames require air-ride lowboys, HTS 8422.30 / 8422.40 customs duties, gantry rigging, and laser leveling |
| WBS 4.0 — Plant Utilities & Facility Drops | 6% – 12% (7.8% in model) |
+10% – +20% of PEC |
Capitalize (CapEx Basis B) as site preparation and utility installation (IAS 16.17) |
Assuming utilities exist at the column when the nearest 480V 3-phase breaker is 250 ft away, European OEM cabinets need 480V/400V isolation transformers, or air headers sag below 80 psi |
| WBS 5.0a — Vendor FSE Installation & FAT/SAT Trial Runs | 4% – 7% (4.8% in model) |
+7% – +12% of PEC |
Capitalize (CapEx Basis B) as pre-readiness testing (IAS 16.17(e) / ASC 360) |
Omitting USD 1,500–USD 2,800/day portal-to-portal vendor Field Service Engineer (FSE) rates and 2–4 shifts of sacrificial film, cartons, and bulk product for FAT and SAT |
| WBS 5.0b — Operator & Maintenance Training + Staff Travel | 1.5% – 3% (2.2% in model) |
+2.5% – +5% of PEC |
Expense Immediately (Period OpEx); strictly barred from capitalization (IAS 16.19(c)) |
Bundling classroom/hands-on training and employee wages into the fixed-asset register, triggering external audit write-offs against quarterly EBITDA |
| WBS 6.0a & 6.0b — Capital Spares vs. Consumable MRO Kit | 2% – 5% (2.5% combined) |
+3% – +8% of PEC |
Split: Tier-1 rotable spares (servo drives, VFDs) Capitalized (WBS 6.0a); wear consumables (belts, suction cups) Expensed / MRO (WBS 6.0b) |
Stripping out the spare-parts kit during value engineering to lower the CAR total by 3%, then losing 3 weeks of production waiting for an air-freighted servo amplifier |
| WBS 8.0 — Risk-Tiered Equipment CapEx Contingency Reserve | 7% – 18% of TIC (9.0% in model) |
+8% – +38% of PEC (5%–25% of Base WBS 1–6) |
Capitalize (CapEx Basis B) to the extent drawn for qualified capital scope |
Applying a flat 10% guess to a brownfield retrofit (Tier C: 18%–25% required) or tying up excess capital on a repeat catalog replacement (Tier A: 5%–8%) |
Why the OEM quote is only 50 to 68 percent of Total Installed Cost
In industrial capital planning, an equipment vendor’s proposal (Ex Works or FOB OEM Factory) prices a machine sitting on wooden skids at the builder’s loading dock. That document does not pay to ship the crate across an ocean, clear customs under the Harmonized Tariff Schedule of the United States (HTSUS Heading 8422), rent a 40-ton hydraulic rigging gantry, pull 200 feet of 480V 3-phase rigid conduit, pipe a sub-micron coalescing compressed-air drop, write PLC starvation/blockage interlocks to neighboring stations, or consume 30,000 printed cartons during Site Acceptance Testing (SAT).
To bridge the gap between bare machinery quotes and real-world project cash outlay, process and manufacturing engineers apply factored estimation methods standardized in AACE International Recommended Practice No. 18R-97 (Cost Estimate Classification System) and AACE 59R-10 (Development of Factored Cost Estimates). Originally derived by Hans J. Lang (1947–1948) for chemical plants—where high-pressure alloy piping, distillation columns, and tank foundations push Total Installed Cost (TIC) to 3.10x Purchased Equipment Cost (PEC) for solids processing, 3.63x for solids-fluid processing, and 4.74x for fluid processing—the factored multiplier adapts directly to discrete manufacturing cells and automated packaging lines installed inside an existing factory building shell.
Governing equations: the Discrete Manufacturing Lang Factor (F_Lang = 1.45x to 1.95x)
For discrete mechanical, assembly, and packaging equipment installed inside an existing industrial facility, the Discrete Automation Lang Factor (F_Lang) spans 1.45 to 1.95 (with a median of 1.65 to 1.75 for a multi-station integrated packaging line). Three governing identities link the vendor’s base machine quote (PEC_OEM) to the complete project budget:
- Total Installed Cost (
TIC) as a Multiple of Base OEM Equipment (PEC_OEM):TIC = PEC_OEM × F_LangwherePEC_OEMis the base OEM machinery and initial format tooling price (WBS 1.0,FOB factory) andF_Langlies between1.45and1.95depending on conveyor integration density, utility drop distance, and brownfield site complexity. - Base OEM Equipment Share (
Share_OEM) of Total Installed Cost:Share_OEM (%) = (PEC_OEM / TIC) × 100% = (1 / F_Lang) × 100%Evaluating this reciprocal across the three standard industrial installation regimes demonstrates why bare machinery sits between51.3%and68.0%of total project spend:- Regime 1 — Drop-In Single Station Replacement (
F_Lang = 1.47x): Replacing an existing checkweigher, labeler, or case taper where480Vpower, air drops, and conveyor elevations already exist yieldsShare_OEM = (1 / 1.47) × 100% = 68.0%ofTIC(ancillary installation, freight, startup, and 6% contingency = 32.0%ofTIC, or a+47%markup on the OEM quote). - Regime 2 — Integrated Multi-Vendor Packaging Cell (
F_Lang = 1.65x to 1.75x): Deploying an interconnected secondary packaging cell (such as a case packer, checkweigher, and spiral accumulation buffer) on an open floor bay yieldsShare_OEM = (1 / 1.724) × 100% = 58.0%ofTIC(ancillary integration, utilities, validation, and 10.2% contingency = 42.0%ofTIC, or a+72.4%markup on the OEM quote). - Regime 3 — Complex Brownfield Washdown Retrofit (
F_Lang = 1.95x): Shoehorning high-speed primary filling or custom robotic automation into a congested24/5operating line with stainless trench drain cutting,480V/400Vharmonic isolation transformers, and an18%–25%brownfield contingency yieldsShare_OEM = (1 / 1.95) × 100% = 51.3%ofTIC(ancillary scope = 48.7%ofTIC, or a+95%markup on the OEM quote).
- Regime 1 — Drop-In Single Station Replacement (
- Additive 8-Bucket WBS Budget Identity (Separating Capitalized Basis
Bfrom PeriodOpEx):Total_Project_AFE = Sum(WBS 1.0 .. WBS 8.0) = B_Capitalized (ASC 360 / IAS 16) + OpEx_Expensed (Training & Consumables)
Rule of thumb: If a draft Capital Appropriation Request (CAR) shows PEC_OEM / Total_Project_AFE > 0.72 (F_Lang < 1.39x) on a multi-machine line—and the project team cannot produce signed fixed-price turnkey installation, utility, and integration quotes proving that ancillary costs are already embedded inside the OEM contract—reject the budget back to engineering for missing WBS scope.
The 8-bucket manufacturing equipment CapEx budget template (WBS 1.0 to 8.0)
To prevent scope gaps between mechanical engineering, plant facilities, purchasing, and corporate accounting, every manufacturing equipment CAR / AFE should be structured around a standardized 8-Bucket Work Breakdown Structure (WBS 1.0 through WBS 8.0).
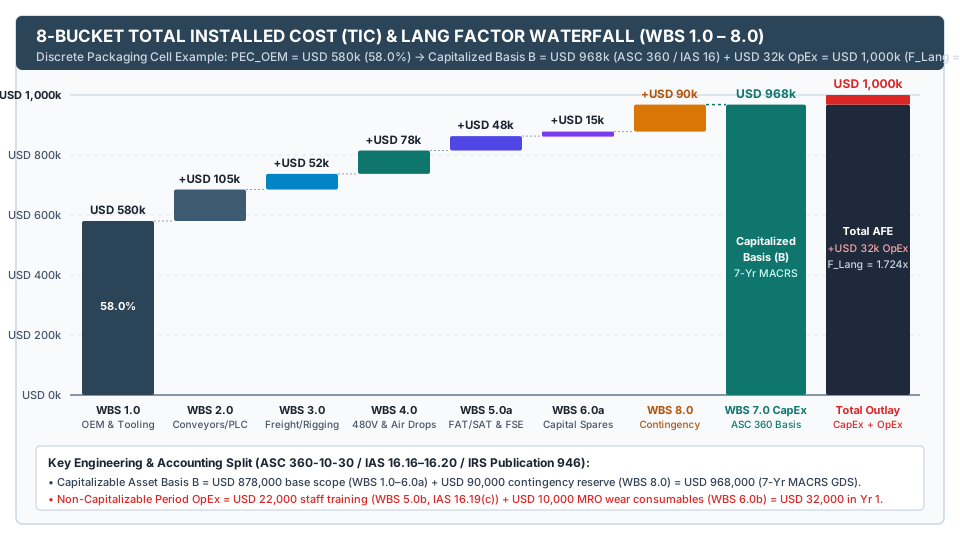
Figure 1: Additive 8-Bucket WBS waterfall transforming a USD 580,000 base OEM machinery quote (58.0% of budget) into a USD 968,000 capitalized fixed-asset cost basis under ASC 360-10-30 / IAS 16 plus USD 32,000 in expensed Year-1 period OpEx (Total AFE = USD 1,000,000; effective Lang Factor = 1.724x).
WBS 1.0 — Base OEM Machinery & Format Tooling (52% – 65% of TIC)
WBS 1.0 captures all hardware, onboard controls, and format-specific tooling fabricated and assembled by the primary machinery builder prior to factory shipment:
- Primary Machine Frame, Motion & Onboard Controls (
FOB Factory): The core mechanical and servo-driven machine (such as a vertical form-fill-sealVFFSbagger, horizontal cartoner, rotary liquid filler/capper, robotic case packer, or gantry palletizer), including washdown frame construction (AISI 304orAISI 316Lstainless steel for food and pharmaceutical environments) and the mainUL 508A/NFPA 79electrical enclosure. - Additional SKU Format Change Parts (
USD 8,000 – USD 35,000per extra SKU set): Standard OEM baseline proposals include format tooling for only one primary SKU (for example, a single pouch width, bottle diameter, or carton footprint). Every additional SKU on the plant’s production schedule requires dedicated forming collars, feed timing screws, starwheels, vacuum manifolds, puck carriers, or carton magazine rails. On a5-SKUpackaging line, omitting4additional change-part sets atUSD 18,000/setcreates an immediateUSD 72,000budget hole. - Machine Guarding & Safety Interlocks (29 CFR § 1910.212 &
ISO 13849-1 PL d): Perimeter polycarbonate or stainless mesh guarding, non-contact RFID coded safety switches (ISO 14119), solenoid guard-locking interlocks on high-inertia coasting stations, dual-channel safety PLC logic (Category 3, Performance LevelPL d, probability of dangerous failure per hourPFHd = 10^-6 to < 10^-5 / hr), and Safe Torque Off (STO) servo drives. - Factory-Mounted Inspection, Checkweighing & Date Coding: Vision inspection cameras, inline dynamic checkweigher load cells, metal-detector or X-ray reject diverters, and thermal-transfer overprinters (
TTO) or continuous inkjet (CIJ) coders mounted directly to the OEM frame.
WBS 2.0 — Upstream/Downstream Conveyance & Line Integration (8% – 14% of TIC)
As detailed in our phased packaging line automation roadmap, a high-speed station cannot deliver its nameplate rate if upstream starvation or downstream case-packing blockage halts the line every three minutes. WBS 2.0 funds the physical and logical bridges connecting the new machine to adjacent stations:
- Sanitary & Modular Transport Conveyors: Tabletop chain, modular plastic belt, or sanitary washdown conveyors, powered nose-bar micro-transfers (for small pouches or unstable vials), lane dividers, and incline/decline elevators.
- Buffer Accumulation Systems (
FIFOtables, bi-directional belts, or vertical spirals): Sized to provide60 to 180 secondsof live product storage between the primary constraint and downstream secondary packaging so routine minor stops (such as a45-secondlabel-roll splice or carton magazine reload) do not force the upstream filler into an emergency cycle stop. - Multi-Vendor Controls & Safety Integration (OPC UA for PackML Companion Specification
OPC 30050/ISA-TR88.00.02): Industrial Ethernet switches, systems integrator PLC programming to harmonizePackMLstate models (Stopped,Idle,Starting,Execute,Held,Suspended,Aborted) and standardizedPackTagsacross multiple vendor PLCs, high/low-level accumulation photo-eye VFD speed modulation, and hardwired dual-channel emergency-stop zone handshakes between machines.
WBS 3.0 — Freight, Rigging, Millwrighting & Import Duties (4% – 8% of TIC)
Under Incoterms 2020, most industrial OEM quotations are issued EXW (Ex Works) or FCA (Free Carrier at the vendor’s facility), placing 100% of inbound logistics, customs tariffs, and floor installation costs onto the buyer:
- Specialized Crating, Ocean/Air Freight & Air-Ride Transport: Vacuum foil moisture-barrier crating for precision servo machinery, ocean container drayage or dedicated climate-controlled air-ride lowboy trucking, oversize highway permits, and marine transit cargo insurance (
typically 0.3%–0.6%of insured equipment value). - Customs Brokerage & Import Tariffs (USITC HTSUS Heading 8422): For machinery imported into the United States from Europe, Asia, or Canada/Mexico,
WBS 3.0must include customs entry brokerage, Merchandise Processing Fees (MPF,0.3464%ad valorem capped at statutory limits), Harbor Maintenance Fees (HMF,0.125%on ocean freight), and applicable duties under HTSUS Subheading 8422.30 (machinery for filling, closing, sealing, or labeling bottles, cans, boxes, bags, or other containers; form-fill-seal machines under8422.30.91.85) or HTSUS Subheading 8422.40 (other packing or wrapping machinery, including shrink wrappers and case packers under8422.40.91.50), plus any applicable Section 301 or reciprocal country-of-origin tariff surcharges. - Dock-to-Floor Rigging & Precision Millwrighting: Heavy-capacity Versa-Lift or counterbalanced forklift rental, hydraulic gantry cranes, machinery skates, temporary removal of plant exterior louvers or roll-up doorway headers, uncrating, multi-section mechanical frame joining, chemical or wedge anchor bolting into the concrete slab, and optical/laser leveling across the entire line centerline (
typically within ±0.5 mm over 10 m).
WBS 4.0 — Plant Utilities & Facility Drops (6% – 12% of TIC)
OEM installation drawings always specify utility connection points “within 1 meter of the main machine drop column”, leaving plant facilities engineering to fund the distribution infrastructure from the building’s main switchgear and compressor room:
480V 3-PhaseElectrical Distribution (NFPA 70 / NEC&NFPA 79): New Motor Control Center (MCC) bucket or main distribution panel breaker, overhead busway tap box, rigid galvanized or washdown stainless steel conduit runs, feeder cables, local lockable safety disconnect switch, active harmonic filters for high-density servo drives, and480V-to-400V/230Visolation/step-down transformers when installing European OEM machinery wired for400VACnominal three-phase power.- Compressed Air, Vacuum & Modified Atmosphere Gas (
MAP) Drops: Branch header piping (anodized aluminum or stainless steel) from the main plant air loop, refrigerated or desiccant air dryer capacity verification to meetISO 8573-1moisture/oil purity classes, local lockout ball valve, and a dedicated FRL assembly (Filter, Regulator, and coalescing sub-micron filter), plus centralized vacuum pump drops or food-grade nitrogen/carbon dioxide (N2 / CO2) gas mixing manifolds. - Chilled Glycol, Dust Extraction & Civil Floor Modifications: Supply-and-return chilled water/glycol drops for thermoforming sealing dies or induction cap sealers, stainless local exhaust ventilation (
LEV) hoods for powder filling dust containment, concrete saw-cutting for new stainless trench drains, chemical-resistant epoxy floor pitching, or local slab thickening under high point-load robotic palletizers.
WBS 5.0 — Engineering, FAT/SAT Validation & Commissioning (5% – 9% of TIC)
As documented in NIST MEP’s Automation 101: How to Plan for Successful Implementation and industry Factory Acceptance Test (FAT) protocols, commissioning requires dedicated engineering labor and real production consumables before the machine ever runs a commercial order:
- Vendor Field Service Engineer (
FSE) Startup Labor (USD 1,500 – USD 2,800 / day+ travel): Portal-to-portal billable daily rates for OEM mechanical millwrights and PLC/servo controls engineers (typically 5 to 15 on-site person-days), plus round-trip airfare, lodging, per diem, and1.5x–2.0xweekend overtime multipliers. - Sacrificial
FAT&SATTrial Materials (2 to 4 full shiftsof materials): Shipping actual bulk product, printed rollstock film, corrugated RSC case blanks, folding cartons, labels, and hot-melt adhesive to the vendor’s factory for the packaging machinery FAT checklist and consuming another2 to 3 shiftsof materials on the plant floor during Site Acceptance Testing (SAT). On a line running150 packs/min(9,000 packs/hr) atUSD 0.25in material and product cost per pack,16 hours(2 shifts) of sacrificial validation trials consumesUSD 36,000in physical inventory. - Qualification Documentation (
IQ / OQ / PQ) & Workforce Training: Authoring and executing Installation Qualification (IQ), Operational Qualification (OQ), safety circuit validation (ISO 13849-2), and structured operator/maintenance training curricula. (Note: UnderASC 360andIAS 16,WBS 5.0splits into capitalizable testing/installationWBS 5.0aand expensed staff trainingWBS 5.0b, as proven in the accounting section below.)
WBS 6.0 — Capitalized Critical Spare Parts vs. Consumable MRO Kit (2% – 5% of TIC)
Collecting the OEM recommended spare parts list before purchase-order release—as required in our equipment procurement records checklist—protects the plant from multi-week startup outages:
- WBS 6.0a — Tier-1 Capitalized Rotable & Insurance Spares (
1.5% – 3.0%of TIC): Long-lead proprietary servo motors, servo amplifiers, Variable Frequency Drives (VFDs), safety controller modules, custom-ground conjugate cams, and specialty load cells with vendor lead times of6 to 16 weeks. UnderIAS 16.8and U.S. tax rotable spare rules, major stand-by spares dedicated to a single asset class and expected to be used over more than one accounting period are capitalized with the parent equipment. - WBS 6.0b — Routine Consumable Wear Parts Kit (
0.5% – 2.0%of TIC): PTFE heat-seal bands, silicone backup rubbers, cartridge heaters, RTD thermocouples, vacuum suction cups, shear knives, photo-eyes, and timing belts. These high-turnover items are booked to Maintenance, Repair, and Operations (MRO) inventory or expensed as period OpEx.
WBS 7.0 & WBS 8.0 — Accounting Split & Risk-Tiered Contingency Reserve
- WBS 7.0 (Capitalized vs. Expensed Accounting Split): The formal ledger reconciliation that partitions
WBS 1.0–6.0plus drawnWBS 8.0into the Depreciable Fixed-Asset Cost Basis (B) versus Year-1 Expensed Period OpEx before the CFO locks the depreciation schedule. - WBS 8.0 (Risk-Tiered Equipment CapEx Contingency Reserve,
5% – 25%of Base Capital Scope): The unallocated project reserve sized byAACE 18R-97estimate class and technical novelty tier (Tier A: 5%–8%,Tier B: 10%–15%,Tier C: 18%–25%) to absorb within-scope installation, interface, and commissioning variances without returning to the board for a supplemental appropriation.
Worked calculation: building a USD 1,000,000 packaging line budget from a USD 580,000 OEM quote
To see how the 8-Bucket WBS operates numerically, consider a manufacturing plant preparing an AACE Class 3 Capital Appropriation Request (CAR) for an integrated secondary packaging cell consisting of a servo case packer, inline checkweigher, and spiral accumulation conveyor. The OEM’s baseline machine quote is USD 520,000 (FOB factory), plus USD 36,000 for two additional SKU change-part sets (2 sets × USD 18,000/set) and USD 24,000 for ISO 13849-1 PL d stainless washdown guarding and vision verification—establishing a WBS 1.0 Base OEM Machinery & Tooling cost (PEC_OEM) of USD 580,000.
| WBS Code & Sub-Account | Budgeted Outlay (USD) |
Share of Total Project (%) |
Markup on USD 580k OEM Quote |
Statutory Accounting & Tax Treatment | Engineering Scope & Calculation Basis |
|---|---|---|---|---|---|
| WBS 1.0 — Base OEM Machinery & Tooling | USD 580,000 |
58.0% |
100.0% (Base PEC) |
Capitalize (ASC 360 / 7-Yr MACRS) |
USD 520,000 base case packer/checkweigher (FOB) + USD 36,000 (2 extra SKU tooling sets @ USD 18k) + USD 24,000 PL d guarding & vision |
| WBS 2.0 — Conveyance & PackML Integration | USD 105,000 |
10.5% |
+18.10% |
Capitalize (ASC 360 / 7-Yr MACRS) |
USD 68,000 sanitary infeed/outfeed conveyors & spiral buffer + USD 37,000 integrator PackML / OPC UA (OPC 30050) PLC & safety interlocks |
| WBS 3.0 — Freight, Rigging & HTS Duties | USD 52,000 |
5.2% |
+8.97% |
Capitalize (ASC 360 / 7-Yr MACRS) |
USD 18,000 container/air-ride freight & insurance + USD 8,000 customs entry & HTS 8422.40 tariff + USD 26,000 gantry rigging & laser leveling |
| WBS 4.0 — Plant Utilities & Facility Drops | USD 78,000 |
7.8% |
+13.45% |
Capitalize (ASC 360 / 7-Yr MACRS) |
USD 46,000 480V 3-phase breaker, 180 ft conduit & 480V/400V transformer + USD 19,000 dry air drop & FRL + USD 13,000 floor drain cut |
| WBS 5.0a — Capitalized FAT/SAT & FSE Startup | USD 48,000 |
4.8% |
+8.28% |
Capitalize (ASC 360 / 7-Yr MACRS) |
USD 24,000 OEM FSE (10 days @ USD 2,000/day + USD 4,000 travel) + USD 16,000 sacrificial FAT/SAT cases & film (3 shifts) + USD 8,000 IQ/OQ |
WBS 5.0b — Operator Training & Travel (OpEx) |
USD 22,000 |
2.2% |
+3.79% |
Expense Immediately (Period OpEx) |
USD 14,000 operator/maintenance training curriculum & trainee wages (IAS 16.19(c)) + USD 8,000 buyer staff travel & admin overhead |
| WBS 6.0a — Tier-1 Capitalized Critical Spares | USD 15,000 |
1.5% |
+2.59% |
Capitalize (ASC 360 / 7-Yr MACRS) |
Long-lead spare servo drive, VFD, and safety controller module ordered on initial equipment PO (IAS 16.8 rotable capital spares) |
WBS 6.0b — Consumable Wear Spares (OpEx) |
USD 10,000 |
1.0% |
+1.72% |
Expense / MRO Inventory (OpEx) |
Vacuum suction cups, PTFE sealing bands, heater cartridges, belts, and photo-eyes booked to routine plant MRO maintenance stores |
WBS 8.0 — Contingency Reserve (Tier B 10.25%) |
USD 90,000 |
9.0% |
+15.52% |
Capitalize (ASC 360 / 7-Yr MACRS) |
Sized at 10.25% of USD 878,000 base capitalizable scope (WBS 1.0–6.0a) for a Class 3 / Tier B multi-vendor packaging cell |
TOTAL PROJECT AUTHORIZATION (AFE) |
USD 1,000,000 |
100.0% |
+72.41% (F_Lang = 1.724x) |
USD 968,000 Capitalized Basis (B) + USD 32,000 Expensed Period OpEx |
Complete cash outlay reconciled across engineering, purchasing, facilities, and corporate tax accounting |
Executing the step-by-step arithmetic reconciliation on this USD 1,000,000 budget:
- Base Capitalizable Scope before Contingency (
WBS 1.0 + 2.0 + 3.0 + 4.0 + 5.0a + 6.0a):B_base = 580,000 + 105,000 + 52,000 + 78,000 + 48,000 + 15,000 = USD 878,000 - Risk-Tiered Contingency Addition (
WBS 8.0at10.25%ofB_base):Contingency = USD 90,000(90,000 / 878,000 = 10.25%, sitting squarely inside the10%–15%Tier Bband). - Total Capitalized Fixed-Asset Cost Basis (
BunderASC 360-10-30andIRS Pub 946):B = B_base + Contingency = 878,000 + 90,000 = USD 968,000(if 100% of the contingency reserve is drawn for qualified capital installation scope; if zero contingency is drawn, final capitalized basis closes atUSD 878,000). - Non-Capitalizable Year-1 Period Operating Expense (
OpEx_1 = WBS 5.0b + WBS 6.0b):OpEx_1 = 22,000 + 10,000 = USD 32,000 - Total Cash Authorization (
AFE) and Effective Lang Factor (F_Lang):Total_AFE = B + OpEx_1 = 968,000 + 32,000 = USD 1,000,000F_Lang = Total_AFE / PEC_OEM = 1,000,000 / 580,000 = 1.7241x(OEM quote = 58.0%of total project outlay).
Takeaway: Separating B = USD 968,000 (capitalized fixed-asset basis) from OpEx_1 = USD 32,000 (expensed training and routine MRO consumables) inside the initial CAR template prevents both a USD 420,000 unbudgeted cash shortfall during installation and a year-end audit adjustment when corporate accounting reviews the fixed-asset subledger.
Capitalized asset basis versus period OpEx (ASC 360, IAS 16 and IRS Pub 946)
Plant engineers frequently assume that every invoice paid out of an approved Capital Appropriation Request (CAR) is automatically capitalized onto the balance sheet and depreciated over seven years. In reality, corporate controllers and external auditors enforce a strict statutory boundary governed by U.S. GAAP (FASB ASC 360-10-30, Property, Plant, and Equipment — Initial Measurement), International Financial Reporting Standards (IAS 16.16–16.20), and U.S. Internal Revenue Code capitalization regulations (26 CFR § 1.263(a)-2 and IRS Publication 946).
The statutory capitalization cutoff: “location and condition necessary for intended use”
Under both ASC 360-10-30-1 and IAS 16.16(b), the historical cost of a piece of manufacturing equipment comprises its purchase price (including import duties and non-refundable purchase taxes, after deducting trade discounts and rebates) plus any costs directly attributable to bringing the asset to the location and condition necessary for it to be capable of operating in the manner intended by management.
Two accounting rules flow directly from this definition:
- Pre-Readiness Testing Is Capitalized (
IAS 16.17(e)/ASC 360): Expenditures for vendor Field Service Engineers (FSEs), millwrights, and sacrificial trial materials (film, cartons, closures, and product) consumed during Factory Acceptance Testing (FAT), Site Acceptance Testing (SAT), and Operational Qualification (OQ) to verify that the physical machine functions properly are capitalized into the asset basisB. - Capitalization Stops at Physical Readiness (
IAS 16.20): The moment the equipment passesSAT/OQand is physically capable of producing conforming output at the plant location, capitalization ceases—even if management delays commercial launch or runs the line at only55% OEEduring Month 1 while operators climb the learning curve. Furthermore, underIAS 16.19(c)and U.S. GAAP, staff training costs can never be capitalized, because training improves the knowledge of employees (whom the entity does not control as a fixed asset) rather than altering the physical condition of the machinery.
| Project Expenditure Line Item | Statutory Classification | Governing Accounting & Tax Authority | Audit & Tax Basis Treatment |
|---|---|---|---|
Base OEM machine, washdown frame, safety guarding & initial SKU change parts (WBS 1.0) |
Capitalize (CapEx Asset Basis B) |
ASC 360-10-30-1 · IAS 16.16(a) · 26 CFR § 1.263(a)-2 |
Core tangible property acquisition cost, net of vendor rebates or early-payment discounts. |
Ocean/air-ride inbound freight, transit insurance & HTS 8422.30 / 8422.40 import duties (WBS 3.0) |
Capitalize (CapEx Asset Basis B) |
ASC 360-10-30 · IAS 16.16(a)–(b) · IRS Pub 946 Ch. 1 |
Non-refundable customs tariffs and freight-in are mandatory costs to bring the machine to the plant location. |
Gantry rigging, slab anchor bolting, laser leveling & dedicated 480V / air drops (WBS 3.0 & 4.0) |
Capitalize (CapEx Asset Basis B) |
IAS 16.17(b)–(c) · ASC 360-10-30 · IRS Pub 946 |
Site preparation, electrical/pneumatic utility drops, and mechanical assembly directly tied to placing the asset in service. |
Vendor FSE startup labor & sacrificial FAT / SAT trial materials (WBS 5.0a) |
Capitalize (CapEx Asset Basis B) |
IAS 16.17(e) · ASC 360-10-30 |
Costs of testing whether the asset is functioning properly prior to sign-off of commercial readiness (SAT / OQ). |
Tier-1 critical rotable/insurance spare parts (servo drives, VFDs with >1 yr life, WBS 6.0a) |
Capitalize (CapEx Asset Basis B) |
IAS 16.8 (Major spare parts & stand-by equipment) · IRS Rotable Spares Rules |
Dedicated major spares expected to be used over more than one period qualify as PP&E and depreciate alongside the host line. |
Operator & maintenance staff training (vendor trainer fees, classroom materials, trainee wages, WBS 5.0b) |
Expense Immediately (Period OpEx) |
IAS 16.19(c) · ASC 360 · FASB EITF |
Strictly barred from capitalization: training builds employee skill rather than bringing the physical machine into operating condition. |
Dismantling or relocating existing plant machines to clear floor space (Brownfield rearrangement) |
Expense Immediately (Period OpEx) |
IAS 16.20(c) · ASC 420 / ASC 360 |
Moving or reorganizing existing production lines is a period operating expense unless part of a qualified structural building improvement. |
Routine consumable wear parts (suction cups, PTFE tape, belts, knives, WBS 6.0b) |
Expense / MRO Inventory (OpEx) |
IAS 16.12 (* Repairs and maintenance*) · 26 CFR § 1.162-4 |
Day-to-day servicing and short-lived consumables are booked to MRO inventory and expensed as consumed. |
| Post-SAT startup scrap, overtime & low-OEE operating losses during Month 1–3 ramp-up | Expense Immediately (Period OpEx / COGS) |
IAS 16.20(b) · ASC 360 |
Initial operating losses incurred after the machine is physically capable of operating (post-SAT) hit current-period cost of goods sold. |
U.S. tax depreciation: IRS Publication 946 MACRS classes, Section 179 and Section 168(k)
Once the accounting split establishes the Capitalized Asset Cost Basis (B, equal to USD 968,000 in our worked model), corporate tax teams determine the statutory tax depreciation schedule (D_t) under 26 U.S.C. § 168 (MACRS), 26 U.S.C. § 179, and IRS Publication 946 (How to Depreciate Property, Appendix B):
-
Standard
7-Year MACRSGDS Recovery Period (Asset Classes 20.1 to 35.0— General Manufacturing & Packaging Machinery): Under IRS Publication 946, Appendix B (Table of Class Lives and Recovery Periods), virtually all discrete manufacturing, processing, and packaging equipment falls under a 7-year General Depreciation System (GDS) recovery period using the200%Declining Balance method switching to Straight-Line under the Half-Year Convention (Table A-1):- Asset Classes 20.1 – 20.4 (Manufacture of Food and Beverages): Class life
12 years→7-year GDS/12-year ADS(including grain, sugar, vegetable oil, and Class 20.4 Manufacture of Other Food and Kindred Products, which governs theB / 7straight-line benchmark in our co-packing services vs. in-house breakeven analysis). - Asset Class 28.0 (Manufacture of Chemicals and Allied Products): Class life
9.5 years→5-year or 7-year GDSdepending on sub-classification. - Asset Class 30.1 (Manufacture of Rubber and Plastics Products): Class life
11 years→7-year GDS/11-year ADS. - Asset Class 34.0 (Manufacture of Fabricated Metal Products): Class life
12 years→7-year GDS/12-year ADS. - Asset Class 35.0 (Manufacture of Industrial and Commercial Machinery): Class life
10 years→7-year GDS/10-year ADS.
Because the Half-Year Convention treats property placed in service at any point during Year 1 as placed in service at the midpoint of Year 1 (generating
0.5 yearsof depreciation in Year 1 and0.5 yearsin Year 8), the statutory 7-Year MACRS GDS annual percentages (IRS Pub 946 Table A-1) span eight calendar tax years:Year 1: 14.29%(USD 138,327onB = USD 968,000)Year 2: 24.49%(USD 237,063)Year 3: 17.49%(USD 169,303)Year 4: 12.49%(USD 120,903)Year 5: 8.93%(USD 86,442— cumulative77.69%recovered through Year 5)Year 6: 8.92%(USD 86,346)Year 7: 8.93%(USD 86,442)Year 8: 4.46%(USD 43,173— cumulative100.00%recovered)
- Asset Classes 20.1 – 20.4 (Manufacture of Food and Beverages): Class life
-
5-Year MACRSGDS Recovery Period (Asset Class 36.0&Class 00.12): If the capital equipment is deployed in Asset Class 36.0 (Manufacture of Electronic Components, Products, and Systems / Semiconductor Manufacturing,6-year class life -> 5-year GDS) or consists of standalone information systems and computer peripheral hardware (Asset Class 00.12,5-year GDS), the recovery period shortens to 5 years (Table A-1Half-Year rates:Yr 1: 20.00%,Yr 2: 32.00%,Yr 3: 19.20%,Yr 4: 11.52%,Yr 5: 11.52%,Yr 6: 5.76%). -
IRC § 168(k)Special Bonus Depreciation vs.IRC § 179Immediate Expensing:- Under the statutory phase-down schedule codified in 26 U.S.C. § 168(k)(6) by the Tax Cuts and Jobs Act (
TCJA), the first-year bonus depreciation percentage on qualified MACRS property (recovery period <= 20 years) steps down by20 percentage pointsper calendar year placed in service:60%in 2024,40%in 2025,20%in 2026, and0%in 2027 and thereafter (with the remaining40%,60%, or80%adjusted basis depreciated simultaneously over the standard7-yearor5-yearMACRS schedule). - Under 26 U.S.C. § 179, small and mid-sized manufacturers whose total annual equipment additions sit below the statutory investment phase-out threshold (
USD 3,050,000in 2024, indexed annually for inflation in 2025–2026) or plants qualifying under post-January 19, 2025 federal full-expensing provisions can elect to deduct up to100%of qualified basisBin Year 1 (up to the statutory dollar cap of USD 1,220,000+ indexed). - Corporate CAR Modeling Standard: Multi-plant corporate finance committees typically evaluate baseline
CAR / AFEcash-flow hurdles using the unaccelerated 7-Year MACRS Table A-1 schedule (as modeled in our 5-year cash-flow verification below) so individual line approvals are not distorted by corporate-level consolidated tax caps, while reporting the§ 168(k)/§ 179accelerated tax shield as an upside sensitivity row.
- Under the statutory phase-down schedule codified in 26 U.S.C. § 168(k)(6) by the Tax Cuts and Jobs Act (
Takeaway: Always verify the plant’s industrial activity code in IRS Publication 946 Appendix B (Classes 20.1–35.0 for 7-year GDS vs. Class 36.0 for 5-year GDS) and strip out WBS 5.0b training and WBS 6.0b consumable wear parts before multiplying the capitalized asset basis B by the MACRS depreciation percentages.
Sizing equipment CapEx contingency by AACE gate and technical novelty
No line item in a manufacturing budget creates more friction between project engineers and corporate finance than equipment capex contingency (WBS 8.0). When an engineer tacks a flat 10% contingency onto every estimate regardless of project maturity or site complexity, two opposite failures occur:
- Failure 1 (Under-budgeting early or complex brownfield projects): At concept screening (
AACE Class 4/5) or on a congested brownfield retrofit, a10%reserve is wiped out during the first weekend shutdown when millwrights hit undocumented slab rebar, legacyPLCracks lack spare I/O slots, or European machines require an unbudgetedUSD 22,000harmonic isolation transformer. - Failure 2 (Over-encumbered capital on simple repeat replacements): At final purchase-order release (
AACE Class 1/2) for a catalog checkweigher or stretch wrapper dropping into an existing bay, holding15%–20%contingency freezes capital authorization that the CFO could allocate to another plant project.
To eliminate arbitrary flat percentages, engineering cost control anchors WBS 8.0 to a two-dimensional framework combining AACE International Recommended Practice No. 18R-97 estimate class maturity (Class 5 down to Class 1) with a 3-Tier Technical & Site Integration Novelty Matrix (Tier A, Tier B, and Tier C).
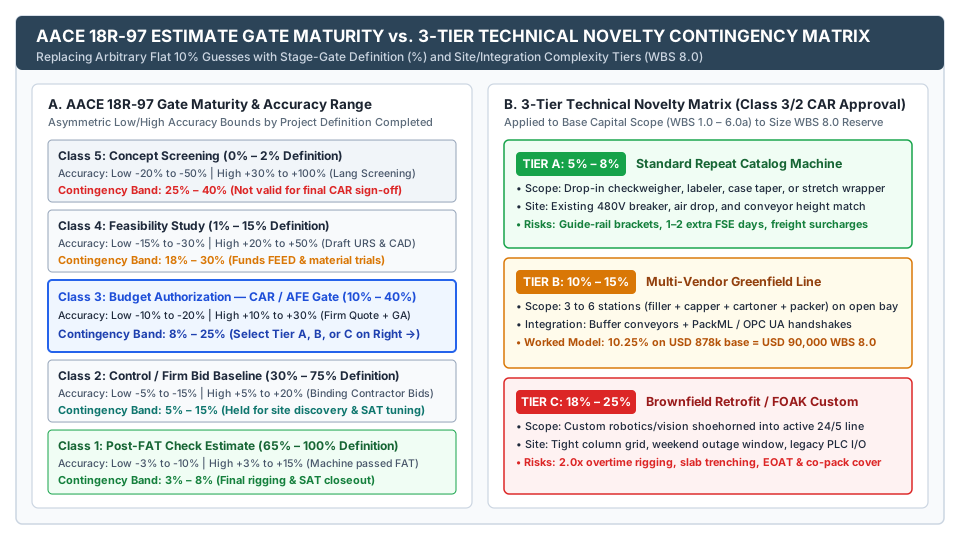
Figure 2: Two-dimensional equipment CapEx contingency framework linking AACE 18R-97 stage-gate project definition (0%–2% at Class 5 down to 65%–100% at Class 1) with the 3-Tier Technical Novelty Matrix at Class 3/2 CAR approval (Tier A: 5%–8%, Tier B: 10%–15%, Tier C: 18%–25%).
Dimension 1: AACE 18R-97 Cost Estimate Classification (Class 5 to Class 1)
AACE 18R-97 classifies capital cost estimates into five maturity classes determined by the percentage of complete project definition (0% to 100%). Notice that AACE accuracy ranges are asymmetric—the potential high-side overrun (+10% to +100%) is always wider than the low-side underrun (-3% to -50%) because omitted scope and site discoveries skew costs upward:
| AACE Estimate Class | Project Definition Completed | Manufacturing Capital Planning Stage Gate | Required Engineering & Procurement Deliverables | AACE 18R-97 Expected Accuracy Range | Recommended Stage-Gate Contingency Band |
|---|---|---|---|---|---|
| Class 5 — Concept Screening | 0% to 2% |
Gate 0: Multi-Year Capital Roadmap / Rough Order of Magnitude (ROM) |
Target pack/min rate, verbal vendor ballpark or historical cost of a prior line; no floor layout, no URS, no utility load list |
Low: -20% to -50%High: +30% to +100% |
25% – 40% (Apply F_Lang = 1.75x–1.95x screening; never use Class 5 for final CAR sign-off) |
| Class 4 — Feasibility / Study | 1% to 15% |
Gate 1: Option Selection (Retrofit vs. Replace or Co-Pack vs. In-House) | Draft User Requirements Specification (URS), block CAD layout on plant floor, budgetary OEM quotes (±25%), factored utility allowances |
Low: -15% to -30%High: +20% to +50% |
18% – 30% (Releases Front-End Engineering Design FEED and material trial funding) |
| Class 3 — Budget Authorization | 10% to 40% |
Gate 2: Formal Capital Expenditure Approval (CAR / AFE) to CFO / Board |
Frozen URS, firm OEM quotes with full SKU tooling matrix, general arrangement (GA) layout, electrical/air load list, contractor rigging/drop budgets |
Low: -10% to -20%High: +10% to +30% |
8% – 25% (Select Tier A 5%–8%, Tier B 10%–15%, or Tier C 18%–25% below) |
| Class 2 — Control / Firm Bid | 30% to 75% |
Gate 3: Final PO Release & Installation Contractor Award | Binding OEM contracts, frozen 3D conveyor/transfer CAD, single-line electrical & piping takeoffs, binding millwright and electrical bids | Low: -5% to -15%High: +5% to +20% |
5% – 15% (Held by project sponsor for site discovery, PLC interface tuning, and SAT rework) |
| Class 1 — Check / Post-FAT | 65% to 100% |
Gate 4: Post-FAT Shipment Release & Pre-Rigging Control | Machine built and witnessed at vendor FAT on actual plant materials, plant utility drops installed, weekend rigging window locked |
Low: -3% to -10%High: +3% to +15% |
3% – 8% (Covers only transit deductibles, final floor shimming, and SAT commissioning) |
Dimension 2: The 3-Tier Technical & Site Integration Novelty Matrix (Tier A, Tier B, Tier C)
When a project reaches Gate 2 / Gate 3 (AACE Class 3 / Class 2 formal CAR / AFE approval), the engineering sponsor selects the specific WBS 8.0 contingency percentage from three technical novelty tiers:
-
Tier A — Standard Repeat Catalog Machine (
5% – 8%Contingency on Base Capital Scope):- Engineering Profile: Like-for-like or capacity replacement of a single standard catalog station (such as an inline checkweigher, pressure-sensitive labeler, uniform case taper, or rotary stretch wrapper) from an established OEM in an existing bay where
480Vbreaker capacity, compressed air drops, and upstream/downstream conveyor top-of-belt (TOB) elevations already match. - Specific Risk Drivers Covered: Minor guide-rail bracket modifications,
1 to 2 extra daysof vendorFSEtuning on a high-slip film lot, or minor freight fuel surcharges. - Sizing Formula:
WBS_8.0_TierA = (0.05 to 0.08) × Sum(WBS 1.0 .. 6.0a).
- Engineering Profile: Like-for-like or capacity replacement of a single standard catalog station (such as an inline checkweigher, pressure-sensitive labeler, uniform case taper, or rotary stretch wrapper) from an established OEM in an existing bay where
-
Tier B — Multi-Vendor Integrated Greenfield Line (
10% – 15%Contingency on Base Capital Scope):- Engineering Profile: Deploying
3 to 6 interconnected stations(for example, a filler + capper + labeler + cartoner + case packer + accumulation table) sourced from two or more OEMs onto an open floor bay, requiring new sanitary/modular conveyors, accumulation buffers, andPackML / OPC UA(ISA-TR88.00.02) line-control integration. - Specific Risk Drivers Covered: Mechanical dead-plate transfer pitch or elevation mismatches between Vendor A and Vendor B,
PLCstarvation/blockage photo-eye debounce debugging, longer overhead conduit or compressed-air header routing around roof columns, and1 to 2 extra shiftsof sacrificialSATpackaging materials. - Sizing Formula:
WBS_8.0_TierB = (0.10 to 0.15) × Sum(WBS 1.0 .. 6.0a). (In our workedUSD 1,000,000model,USD 90,000 / USD 878,000 = 10.25%, sitting at the lower bound ofTier Bbecause contractor quotes for utilities and rigging are already in hand.)
- Engineering Profile: Deploying
-
Tier C — Brownfield Retrofit or First-of-a-Kind (
FOAK) Custom Automation (18% – 25%Contingency on Base Capital Scope):- Engineering Profile: Shoehorning custom robotic pick-and-place cells, 3D vision-guided orienters, or a high-speed station into a congested, operating
24/5production line—or designing a custom prototype machine for a novel package geometry. As detailed in our guides to questions that differ when you retrofit or replace a station and PLC retrofit vs. new machine capital expenditure approval, brownfield retrofits compress installation into tight shutdown windows while interfacing with worn legacy equipment. - Specific Risk Drivers Covered: Weekend and holiday cutover labor at
1.5x to 2.0xmillwright/electrician overtime rates, undocumented underground slab conduits or overhead truss interferences during rigging, legacyPLCor drive obsolescence requiring unplanned I/O rack upgrades, custom robotic end-of-arm tooling (EOAT) vacuum cup or gripper redesign after live product slip, and temporary external co-packing capacity cover if the line outage window overruns. - Sizing Formula:
WBS_8.0_TierC = (0.18 to 0.25) × Sum(WBS 1.0 .. 6.0a).
- Engineering Profile: Shoehorning custom robotic pick-and-place cells, 3D vision-guided orienters, or a high-speed station into a congested, operating
Rule of thumb: If a project includes custom end-of-arm tooling (EOAT) handling an untested flexible pouch or blister, or requires demolishing and re-pouring concrete inside an operating 24/5 packaging room, classify the project as Tier C (18%–25% contingency) even if the primary machine frame is a standard OEM model.
Capital expenditure approval math: NPV, MIRR, MACRS tax shields and OEE ramp-up
Once the engineering team completes the 8-Bucket WBS (Total AFE = USD 1,000,000, split into B = USD 968,000 Capitalized Asset Basis and OpEx_1 = USD 32,000 Expensed Period OpEx), the capital expenditure approval packet (CAR / AFE) moves to the Chief Financial Officer (CFO) and corporate Investment Committee.
Corporate finance rejects automation business cases that divide initial machine cost by theoretical nameplate annual savings (Simple Payback = Quote / Annual Savings) for three reasons:
- Taxes and MACRS Depreciation Shields: Cash operating savings are taxed at the corporation’s combined federal and state marginal income tax rate (
T_tax, typically21%federal plus3%–6%net state =25.0%), while statutory7-year MACRSdepreciation (D_t = B × d_MACRS_t) shieldsD_t × T_taxof cash from taxation each year. - Time Value of Money (
WACCHurdle Rate) & Reinvestment Fallacy (IRR vs. MIRR): Future cash inflows must be discounted at the manufacturer’s Weighted Average Cost of Capital (WACC, typically9.0% to 14.0%nominal;10.0%in our worked model), and intermediate cash flows reinvest atWACC(MIRR), not at an inflated projectIRR. - Post-SAT S-Curve OEE Ramp-Up (
Month 1 = 55%,Month 2 = 72%,Month 3+ = 85%): No integrated manufacturing line achieves its steady-state target Overall Equipment Effectiveness (OEE = Availability × Performance × Quality = 85%) on Day 1 afterSAT.
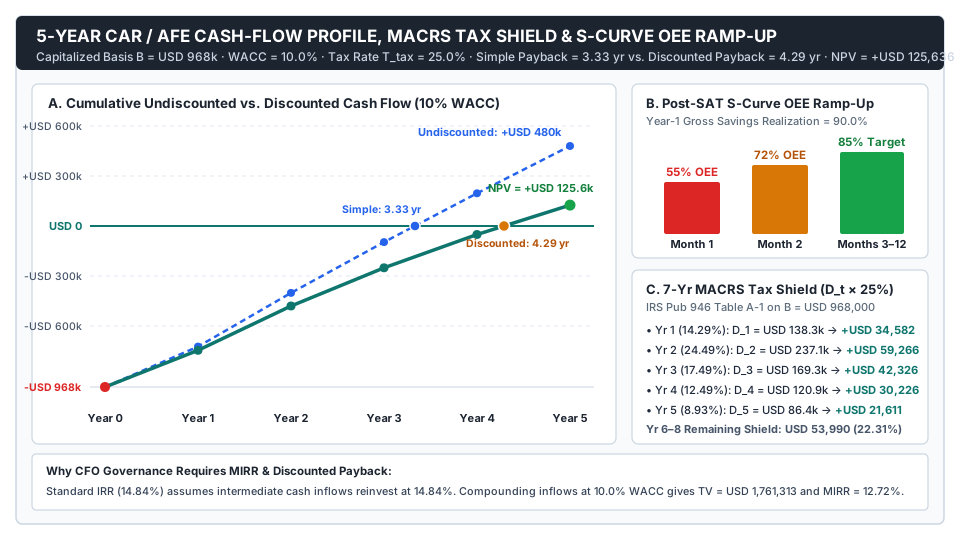
Figure 3: Five-year CAR / AFE cash-flow trajectory for the USD 1,000,000 packaging cell (B = USD 968,000 capitalized basis), illustrating the Month 1–3 S-curve OEE ramp-up (55% to 72% to 85%), annual 7-year MACRS depreciation tax shields at 25% corporate tax rate, and the 11.5-month gap between Simple Payback (3.33 years) and Discounted Payback at 10% WACC (4.29 years).
Governing corporate finance equations for a CAR / AFE packet
Every CFO-ready capital approval model evaluates four coupled equations across an evaluation horizon of N years (typically N = 5 years for discrete automation):
-
Year-1 S-Curve OEE Ramp-Up Realization Factor (
f_ramp_1): Suppose the line’s steady-state target OEE isOEE_target = 85.0%, which generates gross annual pre-tax operating savingsDelta_Savings_steady(from direct labor reassignment, co-packing toll elimination, and film/product scrap reduction). During the first two months post-SAT, operator changeover learning, sensor debounce adjustments, and buffer speed tuning follow a 3-stage S-curve:- Month 1 (
OEE_M1 = 55.0%): Relative output ratio =55.0% / 85.0% = 0.6471(64.71%of steady-state monthly rate). - Month 2 (
OEE_M2 = 72.0%): Relative output ratio =72.0% / 85.0% = 0.8471(84.71%of steady-state monthly rate). - Months 3 through 12 (
10 monthsatOEE_M3+ = 85.0%): Relative output ratio =85.0% / 85.0% = 1.0000(100.0%of steady-state monthly rate). - Theoretical Output Realization Factor (
f_output_1):f_output_1 = [ (1 × 0.6471) + (1 × 0.8471) + (10 × 1.0000) ] / 12 = 11.4942 / 12 = 0.9579(95.79%). - Net Year-1 Gross Savings Realization Factor (
f_ramp_1) after Month 1–2 Startup Scrap & Overtime (~5.79%drag): Deducting elevated Month 1–2 startup scrap and mechanic support overtime (~5.79%of annual gross savings) yields a conservative Net Year-1 Realization Factor off_ramp_1 = 0.9000(90.0%of steady-state gross savings):Delta_Savings_1 = f_ramp_1 × Delta_Savings_steady = 0.90 × Delta_Savings_steady
- Month 1 (
-
Annual After-Tax Cash Flow (
ACF_t) and the MACRS Depreciation Tax Shield (D_t × T_tax): In each operating yeart = 1 .. N, net pre-tax operating cash flow (NOPCF_t) equals gross savings minus routine incremental operating expenses (Delta_OpEx_t: preventive maintenance parts, additional kilowatt-hours, and compressed air)—and in Year 1, minus the non-capitalizable WBS 5.0b / 6.0b period OpEx (OpEx_1):NOPCF_t = Delta_Savings_t − Delta_OpEx_t − (OpEx_1 if t = 1 else 0)Because statutory MACRS tax depreciation (D_t = B × d_MACRS_t) is a non-cash deduction that reduces taxable corporate income byD_t, it creates a positive cash MACRS Depreciation Tax Shield equal toD_t × T_tax:ACF_t = NOPCF_t × (1 − T_tax) + (D_t × T_tax) -
Net Present Value (
NPV) and Discounted Payback Period at Hurdle RateWACC: Discounting each year’s after-tax cash flowACF_tback tot = 0at the corporate hurdle rateWACCagainst initial capitalized outlayB_0(where OpEx_1 is already deducted inside Year 1):NPV = -B_0 + Sum_{t=1..N} [ ACF_t / (1 + WACC)^t ]- Decision Rule: A project clears corporate financial governance if and only if
NPV > USD 0at the risk-adjustedWACC. - Simple (Undiscounted) Payback (
Years): Exact timet_simplewhere cumulative undiscountedSum(ACF_t) = B_0. - Discounted Payback (
Years): Exact timet_discwhere cumulative discountedSum[ ACF_t / (1 + WACC)^t ] = B_0.
- Decision Rule: A project clears corporate financial governance if and only if
-
Internal Rate of Return (
IRR) vs. Modified Internal Rate of Return (MIRR):- Standard
IRRsolves iteratively for the discount rater = IRRwhereNPV(IRR) = 0:0 = -B_0 + Sum_{t=1..N} [ ACF_t / (1 + IRR)^t ] - Modified
IRR(MIRR) eliminates the reinvestment-rate fallacy by compounding all positive intermediate cash inflows (ACF_tfort = 1 .. N) forward to terminal yearNat the corporate reinvestment rateWACCto establish Terminal Value (TV), then solving for the geometric annual yield overNyears:TV = Sum_{t=1..N} [ ACF_t × (1 + WACC)^(N - t) ]MIRR = ( TV / B_0 )^(1 / N) − 1
- Standard
Worked 5-year CAR / AFE cash-flow verification (USD 1,000,000 total budget)
Let us run the complete 5-year CFO hurdle verification on our USD 1,000,000 secondary packaging line (B_0 = USD 968,000 Capitalized Asset Basis at t = 0 plus OpEx_1 = USD 32,000 non-capitalizable WBS 5.0b/6.0b training and MRO consumables expensed in Year 1):
- Steady-State Gross Annual Savings (
Delta_Savings_steady, Years 2–5):USD 380,000 / year(derived from reassigning4manual packing positions across2 shiftsplus corrugated/film scrap reduction). - Routine Incremental Equipment OpEx (
Delta_OpEx_t, Years 1–5):USD 30,000 / year(preventive maintenance wear parts, servo power draw, and compressed air). - Steady-State Net Pre-Tax Operating Cash Flow (
NOPCF_2..5):NOPCF_steady = 380,000 − 30,000 = USD 350,000 / year. - Year-1 Net Pre-Tax Operating Cash Flow (
NOPCF_1with S-Curve Ramp-Up & Expensed WBS 5.0b/6.0b): Applyingf_ramp_1 = 0.90(Month 1 = 55% OEE,Month 2 = 72% OEE,Months 3–12 = 85% OEE) yields Year-1 gross savings of0.90 × 380,000 = USD 342,000. SubtractingUSD 30,000routine OpEx andUSD 32,000non-capitalizable training/MRO OpEx (WBS 5.0b + 6.0b) gives:NOPCF_1 = 342,000 − 30,000 − 32,000 = USD 280,000. - Tax & Hurdle Parameters: Combined marginal corporate tax rate
T_tax = 25.0%(1 − T_tax = 0.75), corporate hurdle rateWACC = 10.0%, and7-Year MACRSGDS Half-Year depreciation (IRS Pub 946 Table A-1) onB = USD 968,000over a conservative5-Yearevaluation window (with zero assumed terminal salvage value).
Year (t) & Operating State |
Net Pre-Tax Operating CF (NOPCF_t) |
After-Tax Operating CF (NOPCF_t × 0.75) |
7-Yr MACRS Rate (Table A-1) |
Tax Depreciation (D_t = 968k × Rate) |
MACRS Tax Shield (D_t × 0.25) |
Total After-Tax Cash Flow (ACF_t) |
Discount Factor (1 / 1.10^t) |
Present Value (PV_t at 10% WACC) |
Cumulative Discounted CF (NPV Trajectory) |
|---|---|---|---|---|---|---|---|---|---|
| Year 0 (Initial CapEx Outlay) | USD 0 |
USD 0 |
0.00% |
USD 0 |
USD 0 |
-USD 968,000 |
1.0000 |
-USD 968,000 |
-USD 968,000 |
Year 1 (55%→72%→85% Ramp + USD 32k OpEx) |
USD 280,000 |
USD 210,000 |
14.29% |
USD 138,327 |
+USD 34,582 |
+USD 244,582 |
0.9091 |
+USD 222,347 |
-USD 745,653 |
Year 2 (85% Steady-State OEE) |
USD 350,000 |
USD 262,500 |
24.49% |
USD 237,063 |
+USD 59,266 |
+USD 321,766 |
0.8264 |
+USD 265,922 |
-USD 479,731 |
Year 3 (85% Steady-State OEE) |
USD 350,000 |
USD 262,500 |
17.49% |
USD 169,303 |
+USD 42,326 |
+USD 304,826 |
0.7513 |
+USD 229,020 |
-USD 250,711 |
Year 4 (85% Steady-State OEE) |
USD 350,000 |
USD 262,500 |
12.49% |
USD 120,903 |
+USD 30,226 |
+USD 292,726 |
0.6830 |
+USD 199,936 |
-USD 50,775 |
Year 5 (85% Steady-State OEE) |
USD 350,000 |
USD 262,500 |
8.93% |
USD 86,442 |
+USD 21,611 |
+USD 284,111 |
0.6209 |
+USD 176,411 |
+USD 125,636 |
5-Year Horizon Totals (Years 1–5) |
USD 1,680,000 |
USD 1,260,000 |
77.69% |
USD 752,038 |
+USD 188,011 |
+USD 1,448,011 |
— | +USD 1,093,636 |
NPV = +USD 125,636 |
(Note: In Years 6, 7, and 8, the remaining 22.31% of unrecovered 7-Year MACRS basis—8.92%, 8.93%, and 4.46%, totaling USD 215,962 of depreciation—generates an additional +USD 53,990 in nominal cash tax shields even if the evaluation model truncates operating cash flows at Year 5.)
Step-by-step verification of the five CFO hurdle metrics
- 5-Year Net Present Value (
NPVatWACC = 10.0%): Summing the Present Values (PV_1throughPV_5) and subtracting initial capitalized basisB_0 = USD 968,000:PV_inflows = 222,347 + 265,922 + 229,020 + 199,936 + 176,411 = USD 1,093,636NPV = -968,000 + 1,093,636 = +USD 125,636(> USD 0→ Passes 10.0% WACC hurdle). - Standard Internal Rate of Return (
IRR): Solving0 = -968,000 + 244,582/(1+r)^1 + 321,766/(1+r)^2 + 304,826/(1+r)^3 + 292,726/(1+r)^4 + 284,111/(1+r)^5yields:IRR = 14.84%(+484 basis pointsabove the10.0%corporateWACC). - Modified Internal Rate of Return (
MIRRreinvesting atWACC = 10.0%): Compounding each year’s after-tax cash inflow forward to Year 5 at10.0%:Year 1 compounded 4 yrs: 244,582 × (1.10)^4 = 244,582 × 1.4641 = USD 358,093Year 2 compounded 3 yrs: 321,766 × (1.10)^3 = 321,766 × 1.3310 = USD 428,271Year 3 compounded 2 yrs: 304,826 × (1.10)^2 = 304,826 × 1.2100 = USD 368,839Year 4 compounded 1 yr: 292,726 × (1.10)^1 = 292,726 × 1.1000 = USD 321,999Year 5 compounded 0 yrs: 284,111 × (1.10)^0 = 284,111 × 1.0000 = USD 284,111- Terminal Value at Year 5 (
TV_5):TV_5 = 358,093 + 428,271 + 368,839 + 321,999 + 284,111 = USD 1,761,313 - Solving for
MIRR:MIRR = ( 1,761,313 / 968,000 )^(1 / 5) − 1 = (1.819538)^0.20 − 1 = 0.12718 = 12.72%Notice thatMIRR(12.72%) is2.12 percentage pointslower than standardIRR(14.84%), providing the CFO with an uninflated yield that still clears the10.0%hurdle rate by272 basis points.
- Simple (Undiscounted) Payback Period (
3.33 Years/40.0 Months): Cumulative undiscountedACF_treaches244,582 + 321,766 + 304,826 = USD 871,174at the end of Year 3, leaving968,000 − 871,174 = USD 96,826to recover in Year 4 (where ACF_4 = USD 292,726):Simple_Payback = 3.00 + (96,826 / 292,726) = 3.331 years(39.97 months). - Discounted Payback Period at
10.0% WACC(4.29 Years/51.5 Months): Cumulative discounted cash flow sits at-USD 50,775at the end of Year 4 and crosses zero during Year 5 (where PV_5 = USD 176,411):Discounted_Payback = 4.00 + (50,775 / 176,411) = 4.288 years(51.45 months)—demonstrating that time-value discounting adds0.96 years(11.5 months) to the payback clock.
Calculation takeaway: A naive presenter who divides the USD 580,000 OEM machine quote by USD 380,000 in gross savings claims a 1.53-year payback. Once the full USD 1,000,000 WBS outlay, 25% corporate tax rate, 7-year MACRS shield, Month 1–2 OEE ramp-up, and 10% WACC discount factor are properly modeled, true Simple Payback is 3.33 years and Discounted Payback is 4.29 years with an NPV of +USD 125,636 and MIRR of 12.72%.
Pre-submission CAR / AFE engineering and finance audit checklist
Before routing a capital expenditure approval packet for plant-manager, controller, and CFO signatures, verify six boundary conditions across engineering and accounting:
- Line-Balance Verification Before Capital Release (
WBS 1.0 & 2.0): Confirm via our phased packaging line automation roadmap that downstream good-pack clearance exceeds required good-pack demand (Required rate = Required good packs / Scheduled operating minutes) so the newly budgeted machine is not immediately blocked by a slower case packer or palletizer. - Complete SKU Change-Part Matrix (
WBS 1.0): Cross-check the OEM proposal against every active and planned SKU dimension in the commercial forecast so no unquotedUSD 8,000–USD 35,000format change-part kits remain outsideWBS 1.0. - Incoterms, Tariff Classification & Rigging Path Survey (
WBS 3.0): Verify whether the vendor quote isEXW / FCAorDDP, confirm customs duty rates underHTSUS 8422.30or8422.40for imported equipment, and walk the physical rigging path from the receiving dock to the line centerline to measure doorway header clearances and slab point-load ratings. - Electrical Voltage, Harmonic & Air-Header Audit (
WBS 4.0): Check whether the OEM control cabinet is built for480VAC 60Hzor400VAC 50/60Hz(requiring a step-down isolation transformer), measure distance to the nearest spare breaker in theMCC, and verify compressed-air pressure stability (>= 85–90 psiunder peak shift load). - Traceable FAT/SAT Material Reconciliation (
WBS 5.0a): Budget2 to 4 shiftsof sacrificial packaging materials and bulk product insideWBS 5.0a, and pair the purchase order with the packaging machinery FAT records checklist and equipment procurement checklist. - Make-vs-Buy Breakeven Cross-Check: When annual pack volume is uncertain or seasonal, test the total capitalized asset basis
B(WBS 1.0–6.0a + WBS 8.0) against external contract-packing unit tolls using our co-packing services vs. in-house breakeven formula (N = (F − S) / (t − v)) before locking capital into fixed machinery.
When this template does not apply
- Heavy Continuous Chemical, Petrochemical or Refining Process Plants: The discrete manufacturing Lang Factor (
F_Lang = 1.45x–1.95x, where base OEM equipment is50%–68%ofTIC) applies to mechanical, assembly, and packaging lines installed inside an existing industrial building shell. Continuous fluid or solids-fluid chemical process plants with outdoor structural steel, high-pressure alloy piping, and tank farms exhibit classic process Lang Factors of3.10x to 4.74x(where bare equipment is only 21%–32% of TIC). - Greenfield Building Construction & Real Estate Acquisition (
39-Year Nonresidential Real Property): Structural building shells, roof trusses, primary substation transformers serving the entire facility, and land improvements are depreciated over39 years(or15 yearsfor qualified land/site improvements) under IRS Publication 946, not the7-year(Classes 20.1–35.0) or5-year(Class 36.0) MACRS schedules used for manufacturing machinery. - Equipment Operating Leases (
ASC 842/IFRS 16) and Rentals: Machinery acquired under a short-term rental or operating lease is accounted for via Right-of-Use (ROU) lease assets and lease liabilities underFASB ASC 842rather than capitalized fixed-assetPP&EunderASC 360-10-30. - Software-Only MES / ERP / Cloud Subscriptions (
ASC 350-40): Standalone cloud software-as-a-service (SaaS) and plant-wide ERP implementations follow internal-use software capitalization rules (ASC 350-40), whereas onboard machine PLC firmware andPackML / OPC UAline-integration logic purchased to make the hardware function (WBS 1.0 & WBS 2.0) are capitalized into tangible machinery basisB.
Method and sources
This engineering and corporate-finance reference synthesizes public cost-estimating standards, accounting standards, and U.S. tax statutes:
- Cost Estimate Classification & Factored Multipliers: Estimate maturity classes (
Class 5throughClass 1), project definition percentages, asymmetric accuracy bounds, and factored equipment estimation methodology follow AACE International Recommended Practice No. 18R-97 andAACE 59R-10. - Capitalization vs. Period Expense Boundary: The division between capitalizable pre-readiness asset costs (
WBS 1.0–5.0a, 6.0a, 8.0) and immediately expensed operator training, rearrangement, and post-SAT operating losses (WBS 5.0b, 6.0b) follows IAS 16 (Property, Plant and Equipment, §§ 16–20),FASB ASC 360-10-30, and26 CFR § 1.263(a)-2. - U.S. Tax Depreciation & Tariff Schedules: The
7-year(Classes 20.1–35.0) and5-year(Class 36.0) General Depreciation System (GDS) recovery periods and Half-Year convention rates (Table A-1) are sourced from IRS Publication 946 (2025), Appendix B, alongside 26 U.S.C. § 168 and 26 U.S.C. § 179. Packaging machinery tariff classifications reference HTSUS Chapter 84, Heading 8422 (8422.30and8422.40). - Controls, Safety & Commissioning Standards: Multi-vendor line state models reference the OPC UA for PackML Companion Specification (
OPC 30050/ANSI/ISA-TR88.00.02), machine guarding requirements reference 29 CFR § 1910.212 andISO 13849-1 PL d, and commissioning planning aligns with NIST MEP’s Automation 101 and Frain Industries’ FAT overview. All worked dollar figures (USD 580,000OEM quote,USD 968,000capitalized basis,USD 32,000OpEx, andUSD 380,000annual gross savings) are conditional calculation examples demonstrating how a plant’s own vendor quotes, tax rates, and hurdle rates pass through the governing equations.