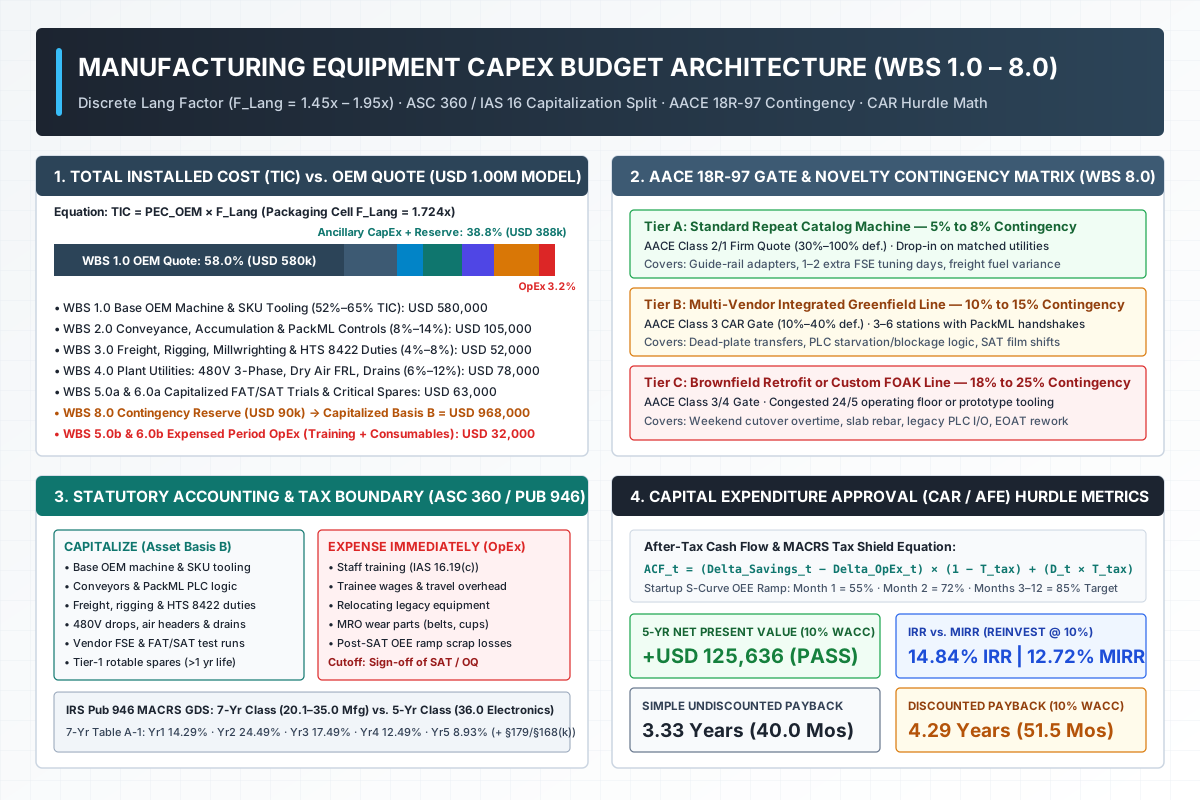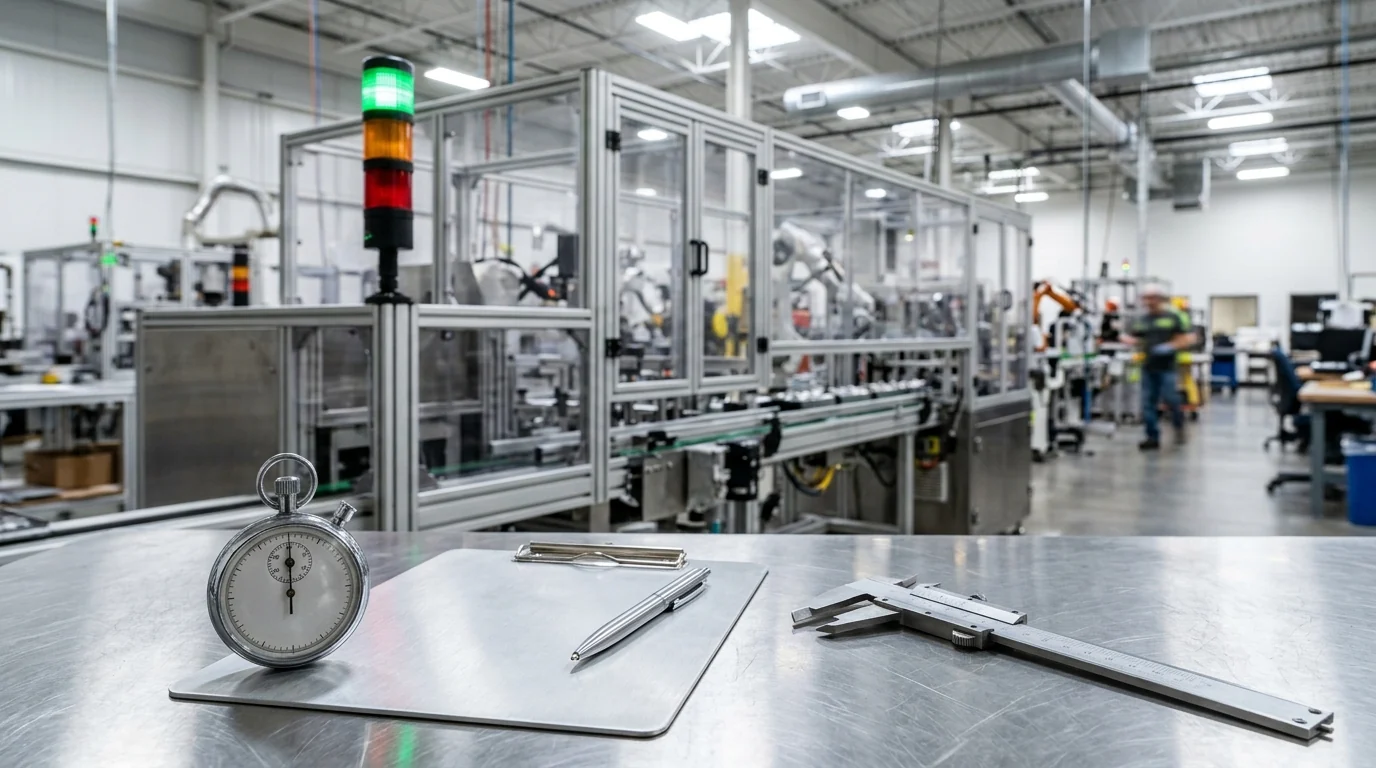
Within our capital planning workflow, engineering and operations teams separate bottleneck throughput losses from buffer-absorbed stops, startup scrap, overtime recovery wages, and equipment RFP maintainability requirements before submitting a business case.
Viking Masek reports that the average cost of unplanned downtime in manufacturing can range from $10,000 to $25,000 per hour, depending on the complexity and scale of the operation.
Viking Masek states that the cost of unplanned downtime includes lost production, idle labor, overtime (rushing to catch up once the line is back online), missed deadlines, wasted materials, and emergency repair costs.
Wolf Packing states that most facilities underestimate true downtime costs by 5 to 10 times because the losses go far beyond repair parts to include lost production, spoiled product, missed shipments, and labor recovery.
OpenStax Principles of Finance defines Net Present Value (NPV) as the difference between the present value of cash inflows and the present value of cash outflows (NPV = PV Cash Inflows - PV Cash Outflows), where a project adds value and should be accepted if cash inflows exceed cash outflows in present value terms.
Macro Maintenance Baselines Versus Facility-Scale Stoppage Dispersion
Review national discrete manufacturing maintenance records alongside facility-scale stoppage tiers before entering downtime avoidance estimates into a packaging line investment case.
In NIST’s 2016 U.S. discrete manufacturing survey for NAICS 321-339 (excluding 324 and 325), machinery maintenance expenditures were estimated to be $57.3 billion.
In NIST’s U.S. discrete manufacturing analysis, additional expenditures due to faults and failures were estimated at $16.3 billion, inventory to buffer against maintenance issues costed $0.9 billion, and total maintenance activities costed $74.5 billion.
In NIST’s 2016 U.S. discrete manufacturing analysis, losses due to preventable maintenance issues amounted to $119.1 billion: $18.1 billion due to downtime, $0.8 billion due to defects, and $100.2 billion due to lost sales from delays and defects.
In NIST’s unplanned downtime methodology, to estimate the cost of unplanned downtime, the percent of planned production time that is unplanned downtime due to maintenance issues is multiplied by the cost of energy, labor, and capital.
In NIST’s U.S. discrete manufacturing downtime cost breakdown ($18.1 billion total), labor costs range from $12.1 billion to $13.8 billion, machinery capital costs range from $2.5 billion to $2.6 billion, buildings are $1.0 billion, and energy is $1.1 billion to $1.3 billion.
In NIST’s unplanned downtime analysis for NAICS 321-339, planned production time that is unplanned downtime averaged 7.8 % and downtime due to reactive maintenance averaged 31.7 %, with a 90 % confidence interval for total downtime cost between $9.4 billion and $29.5 billion.
| Maintenance or facility benchmark dimension | Grounded industry and survey finding |
|---|---|
| Reactive maintenance share | In NIST’s survey of U.S. discrete manufacturers, on average 45.7 % of machinery maintenance was reactive maintenance. |
| Top-quartile reactive downtime impact | In NIST’s Machinery Maintenance Survey, the top 25 % of establishments relying on reactive maintenance was associated with 3.3 times more downtime than those in the bottom 25 %. |
| Top-quartile reactive defect and delay impact | In NIST’s Machinery Maintenance Survey, establishments in the top quartile of reactive maintenance had 16.0 times more defects, 2.8 more lost sales due to defects, 2.4 times more lost sales due to delays, and 4.9 times more inventory increases. |
| Predictive maintenance impact | In NIST’s survey, among establishments with less than 50 % reactive maintenance, the top 50 % in predictive maintenance was associated with 15 % less downtime, an 87 % lower defect rate, and 66 % less inventory increases due to unplanned maintenance. |
| Monthly and weekly interruption frequency | Wolf Packing reports that 44% of operations leaders report equipment-related interruptions at least monthly, and 14% deal with them weekly. |
| Per-minute stoppage cost by facility scale | Wolf Packing reports per-minute unplanned stoppage costs by facility scale of $3,000–$10,000+ per minute for large high-speed facilities, $800–$2,500 per minute for mid-size facilities, and $200–$500 per minute for small operations. |
| Small-line stop versus lost-shift bounds | Wolf Packing states that even at the low end, a two-hour unplanned stoppage on a small line costs up to $60,000, while at the high end a single shift lost to a major failure can exceed $700,000. |
| Planned window versus minor and major failures | Wolf Packing compares planned maintenance at |
| Annual reactive, preventive, and predictive totals | Wolf Packing compares annual strategy totals of $850,000 for Reactive ($50,000 maintenance + $800,000 downtime), $350,000 for Preventive ($150,000 maintenance + $200,000 downtime, cutting total cost by 59%), and $300,000 for Predictive ($250,000 maintenance + $50,000 downtime, cutting total cost by 65%). |
Bottleneck Machine Downtime Cost Versus Non-Bottleneck Buffer Absorption
Distinguish stops at the primary line constraint from brief upstream or downstream interruptions absorbed by accumulation buffers when auditing overall equipment effectiveness records and phased packaging line automation roadmaps.
NIST states that equipment capability, capacity, and state data enable identifying and characterizing bottleneck equipment (workstations and systems) so maintenance operations management can determine maintenance priorities.
NIST specifies that system-level maintenance and production queue decisions require supporting data on equipment capability, availability, and capacity, priority/criticality of tasks, availability of resources, impacts on throughput, and current buffer states.
OEE.com instructs manufacturers that to understand where losses occur in production and unlock the hidden factory, they must first make sure they are measuring losses that affect their manufacturing constraint.
Ruida Packing instructs teams not to calculate production line OEE by averaging the OEE percentages of individual machines, but to measure the line against its own planned time, defined rate, total output, and good output.
OEE.com defines Equipment Failure as an Availability Loss including being starved by upstream equipment or blocked by downstream equipment, and notes a rule of thumb to set the Equipment Failure versus minor-stop threshold based on your reason-tracking policy—for example, treating any downtime longer than two minutes as Equipment Failure.
Viking Masek illustrates that on a standard intermittent vertical seal machine running 50 products per minute, one hour of unplanned downtime represents 3,000 products that were not made, and one eight-hour shift is 24,000 products.
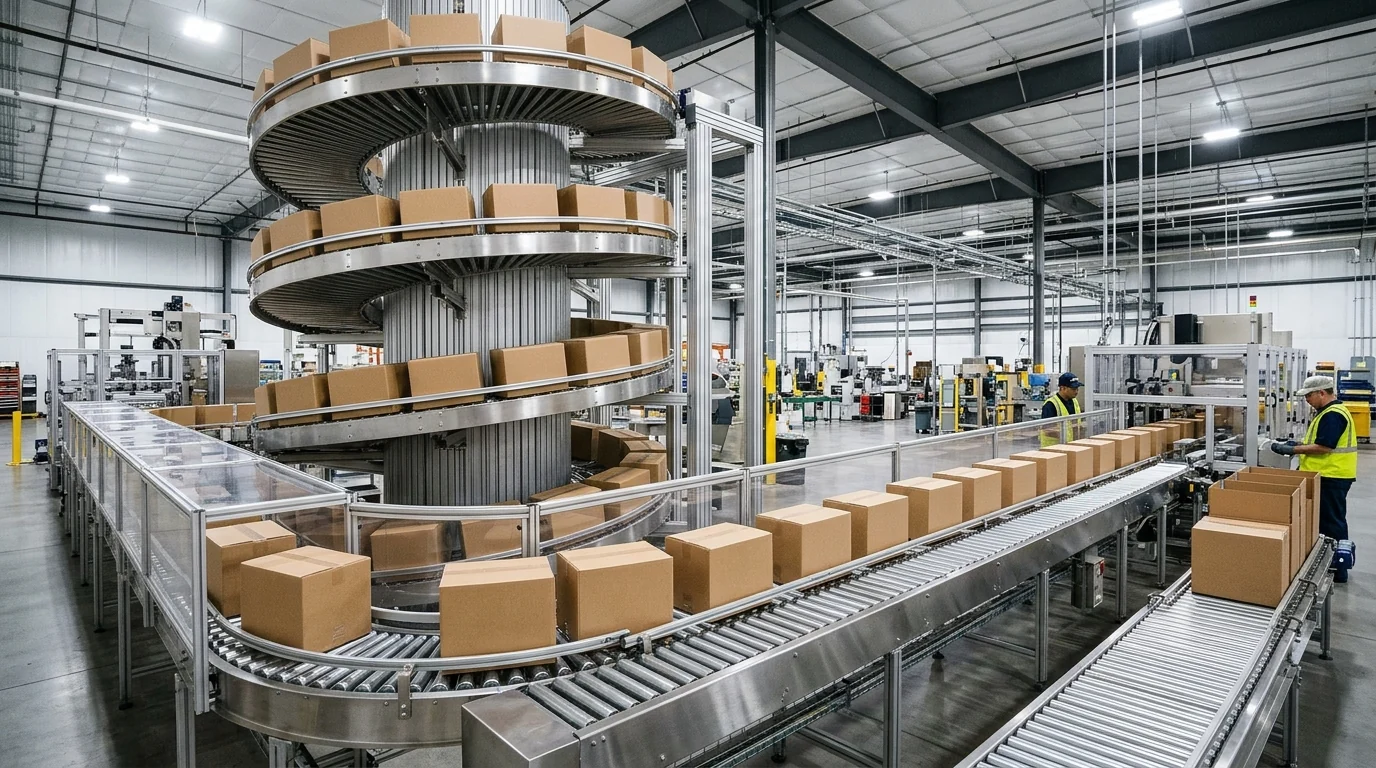
Verify whether inter-station accumulation buffers decouple upstream or downstream interruptions before pricing an hour of machine stoppage as lost line output.
Accumulation Decoupling and Bottleneck Audit Evidence
Evaluate buffer capacity and material-feed delays across connected stations before sizing replacement machinery.
Wolf Packing states that buffer zones prevent machine stoppages during brief upstream interruptions, that properly sized buffers can improve overall line efficiency by up to 11%, and that buffer capacity should cover the longest anticipated upstream interruption plus a 20% margin.
Syntegon states that on neXt packaging lines, the DRFG Gondola Buffer maintains continuous product flow between upstream and downstream equipment, decoupling process and packaging sections to protect overall output from isolated stops, and stores up to 600 rows of products.
In Syntegon’s technical audit of three liquid pharmaceutical lines where jams in the packaging material feed repeatedly caused short delays, the technical audit—addressing filling-machine bottlenecks, primary-packaging tilts and rotations, and control-software changes—increased output by ten percent on the three lines.
In the PMMI Quickie Survey on Overall Equipment Effectiveness (35 respondents), 45.7% currently offer a solution that tracks OEE, and among current offerings the most commonly tracked KPIs are downtime (93.8%), output (87.5%), and performance (87.5%).
Startup and Restart Scrap Versus Steady-State Defects and Changeovers
Separate post-stop warm-up rejects and web re-threading waste from steady-state defects so restart losses are properly represented inside the manufacturing equipment CapEx budget template.
The Lean Enterprise Institute defines OEE as Availability Rate x Performance Rate x Quality Rate = OEE, illustrating that if Availability is 90%, Performance is 95%, and Quality is 99%, then 0.90 x 0.95 x 0.99 = 84.6% OEE.
OEE.com defines Idling and Minor Stops (small stops) as a Performance Loss where equipment stops for a short period (typically a minute or two, and well under five minutes) with the stop resolved by the operator.
OEE.com distinguishes Process Defects (defective parts produced during stable steady-state production) from Reduced Yield (defective parts produced from startup until stable steady-state production is reached).
The Lean Suite defines Reduced Yield as scrap and rework generated during startup, warm-up, or the first minutes after a changeover before thermal or mechanical equilibrium, noting that separating them keeps a startup problem from being treated as a steady-state one.
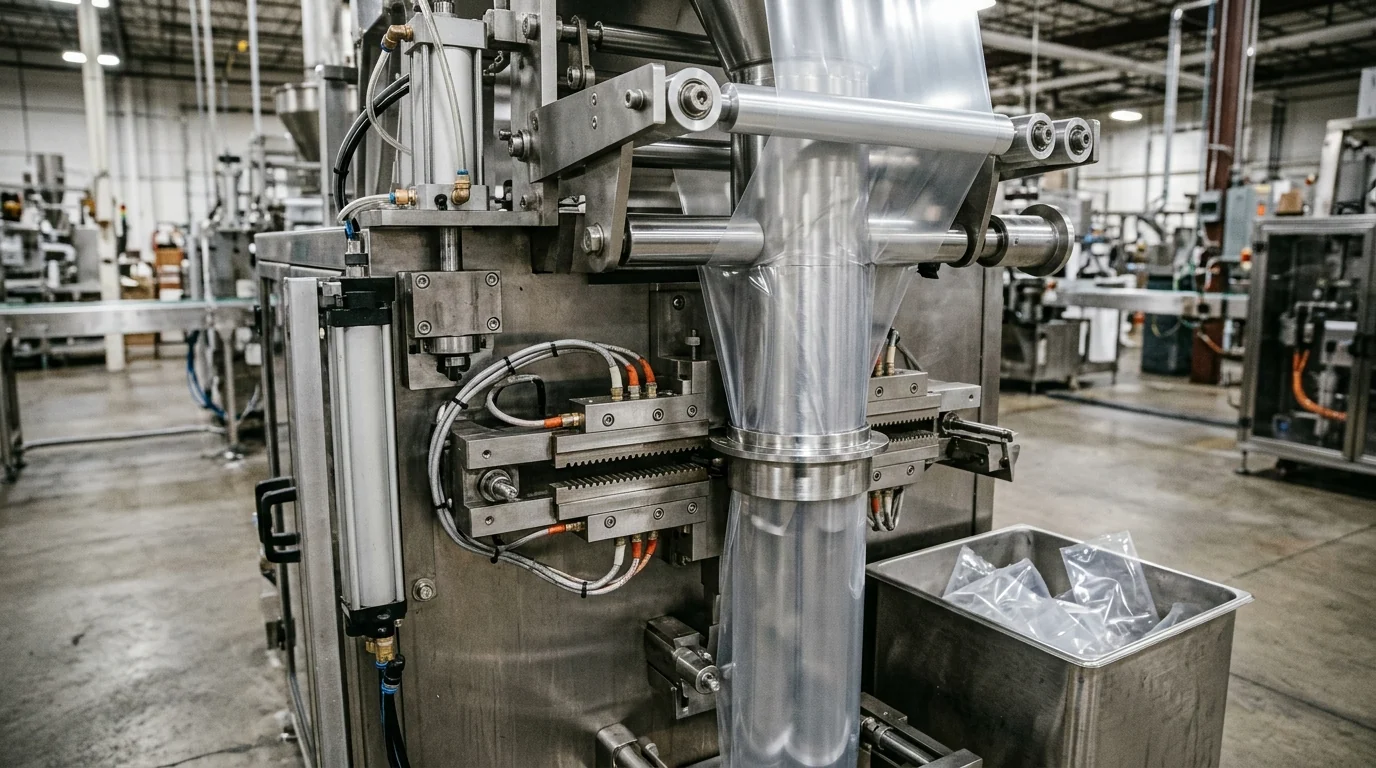
Separate startup and post-stop sealing stabilization scrap from steady-state quality rejects in shift production logs.
| Shift loss or changeover category | Grounded engineering definition and shift example |
|---|---|
| Equivalent lost shift minutes across losses | In The Lean Suite’s 480-minute CNC shift example, equivalent lost minutes across the Six Big Losses are 40, 35, 28, about 38 (10% of 377 running minutes), 24, and 12, totaling roughly 177 minutes and leaving about 303 productive minutes (OEE near 63%). |
| Changeover time boundary | The Lean Enterprise Institute defines changeover time as the time elapsed between the last piece in the run just completed and the first good piece from the process after the changeover. |
| Internal versus external setup separation | The Lean Enterprise Institute defines Single Minute Exchange of Die (SMED) as reducing changeover times to less than 10 minutes by separating internal setup operations (done only when a machine is stopped) from external operations (performed while running). |
| Changeover reduction capacity recovery | In Wolf Packing’s SMED case study, reducing changeover time by 88% from 80 minutes to 9 minutes per switch across three daily changeovers created 213 minutes (3.55 hours) of new production time, equaling $7,100 in daily recovered capacity at $2,000 revenue per hour. |
| Isolated metric optimization warning | The Flexographic Technical Association (FTA) warns that monitoring KPIs such as waste, run time, downtime, or makeready individually can present false savings or ‘funny money,’ citing a hypothetical 17-in., 8-color press project with a 20 percent makeready reduction goal where a 25 percent makeready improvement increased downtime. |
| Planned roll changes plus unplanned web stops | In FTA’s 480-minute shift example, 120 minutes of planned downtime (3 roll changes/hour at 5 minutes each = 15 minutes x 8 hours) plus 32 minutes of unplanned downtime (20-minute ink blowout and 12-minute web break) equals 152 minutes of total downtime, yielding 68.3 percent Availability. |
Overtime Catch-Up Labor Premiums Versus Lost Contribution Margin
Check whether missed shift output is recovered during unscheduled hours through overtime staffing or represents unrecoverable capacity loss by comparing shift scheduling versus machine additions.
OEE.com defines Schedule Loss as time where production could be running but is not scheduled, noting that it is the largest component of the hidden factory for most one- or two-shift operations and is typically addressed with overtime (short-term) or additional staff (long-term) to defer capital expenditures.
OEE.com defines TEEP = OEE × Utilization; in an operation with 65.00% OEE running two 8-hour shifts per day, five days per week (80 hours Planned Production Time / 168 hours All Time = 47.62% Utilization), TEEP is 30.95%.
The Federal Reserve Board defines an industry’s capacity utilization rate as an output index divided by a capacity index capturing sustainable maximum output within a realistic work schedule after factoring in normal downtime.
The U.S. Census Bureau Quarterly Survey of Plant Capacity Utilization (QPC) produces estimates across 93 QPC industry groups from a sample of roughly 7,500 establishments using the ratio of actual value of production to estimated value of full production multiplied by 100.
Under the U.S. Department of Labor Fair Labor Standards Act (FLSA), covered nonexempt employees must receive overtime pay for hours worked over 40 per workweek (a fixed and regularly recurring period of 168 hours – seven consecutive 24-hour periods) at a rate not less than one and one-half times the regular rate of pay.
The U.S. Department of Labor states that extra pay for working weekends or nights is a matter of agreement between the employer and the employee, while the FLSA requires not less than time and one-half the regular rate for time worked over 40 hours in a workweek.
| Operating schedule and station regime | CapEx cash-flow modeling rule |
|---|---|
| Non-bottleneck stop shorter than buffer depletion window | Record modeling choice on capital worksheet |
| Bottleneck stop in a plant with unscheduled shift capacity | Record modeling choice on capital worksheet |
| Bottleneck stop in a schedule-saturated plant with no buffer | Record modeling choice on capital worksheet |
Contractual Late-Delivery Risk and Maintainability Clauses in the Equipment RFP
Translate floor downtime drivers into enforceable reliability targets, service response tiers, and spare-parts staging requirements when preparing a station retrofit versus replacement review, an equipment procurement checklist, a packaging machinery factory acceptance test checklist, and an NPV versus simple payback comparison.
NIST MEP’s Automation 101 checklist instructs manufacturers to determine early on what the initiative is worth, not automate anything that is not a lean process, and not underestimate the importance of technical specs for RFPs by having a plan before asking an automation vendor for a quote.
In the NIST/SEMATECH e-Handbook of Statistical Methods, under the Homogeneous Poisson Process (HPP) model for repairable equipment on the flat constant repair rate portion of the Bathtub Curve with repair rate (ROCOF) m(t) = lambda, Mean Time Between Failures (MTBF) is 1 / lambda.
In Kenwei’s multihead weigher reliability guide, recommended procurement targets are Uptime >95% for high-volume lines, MTBF of 2,000–5,000 hours, MTTR <4 hours with on-site spare parts or <24 hours otherwise, and Reject/Jam Rate <0.5% for optimized product formats; Kenwei notes that remote diagnostics can cut initial troubleshooting time by up to 50%, that many vendors use SLAs such as 4-hour remote response and 24-hour on-site dispatch, and that buyers should demand a FAT protocol with pass/fail criteria for each reliability metric.
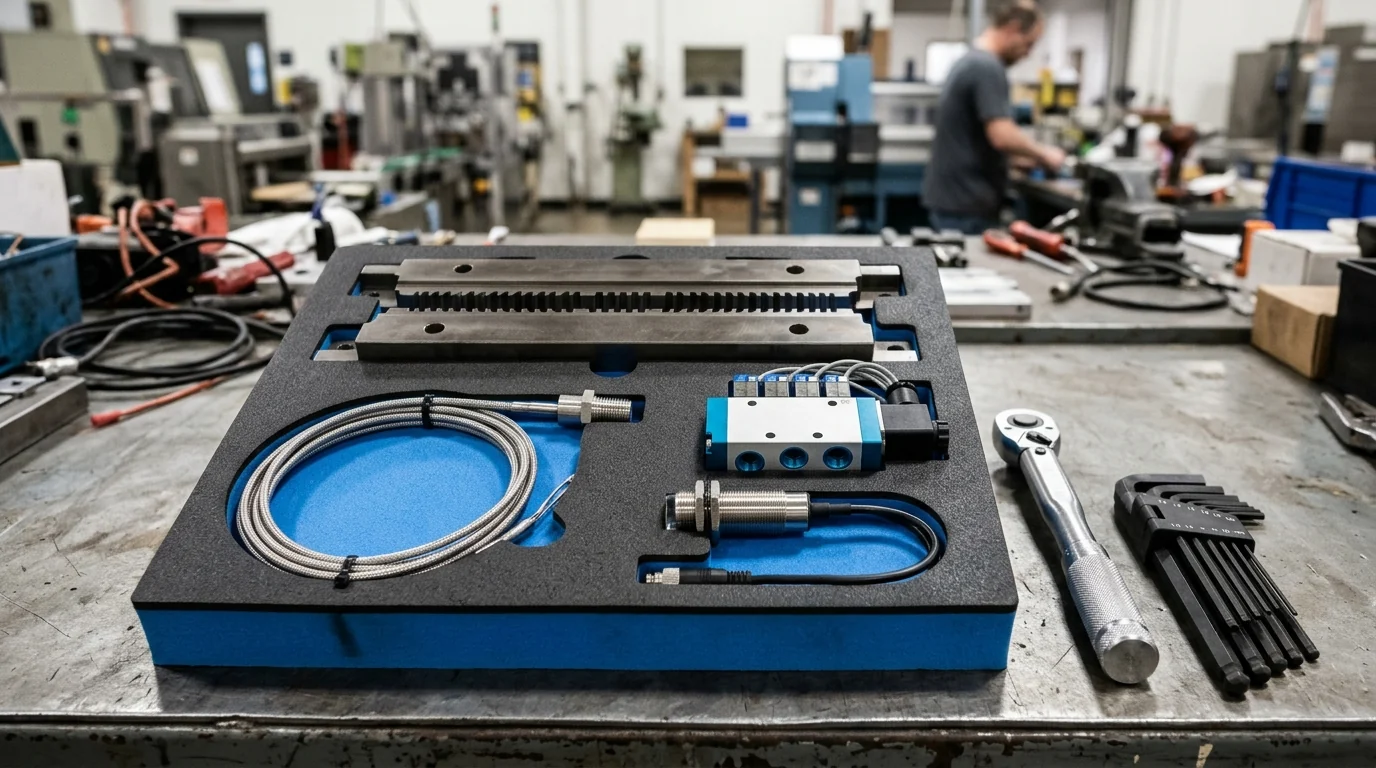
Stage wear components and long-lead critical spares on-site so component replacement completes during a brief changeover window rather than halting production.
| Equipment RFP maintainability and spares item | Grounded cost exposure and specification evidence |
|---|---|
| Overnight sensor and valve wait exposure | Spack Machine reports that an unplanned stop on a high-speed premade pouch line burns $8,000–$15,000 per hour, while factories often wait overnight for a $120 thermocouple or a $400 pneumatic valve. |
| Sealing jaw wear life and spare kit impact | Spack Machine notes that sealing jaws warp or wear after 500,000 cycles, where a spare jaw kit on hand converts a 6-hour teardown-and-order into a 30-minute changeover, while a $30 sensor failure without a spare stops the entire line. |
| Custom component manufacturing lead-time exposure | Viking Masek states that custom packaging equipment components can carry 8-to-12-week manufacturing lead times, recommends a spare parts list tiered by failure likelihood and consequence, and notes that a critical component with a 10-week standard lead time failing on a line producing $50,000 of product per shift costs far more idle than stocked. |
Unplanned Downtime Four-Driver Cost and CapEx Justification Record Sheet
Complete this plant-floor record sheet across the target production line and attach the verified logs to your factory automation capital request and equipment RFP package.
| Cost driver or RFP audit category | Floor observation and accounting input to verify | Plant record entry |
|---|---|---|
| Line boundary and constraint identification | Primary bottleneck station, upstream feeders, downstream packers, and discharge counter location | Record on capital worksheet |
| Inter-station accumulation buffer window | Physical buffer storage capacity and drain duration before the constraint starves or blocks | Record on capital worksheet |
| Shift calendar and unscheduled recovery window | Active shift schedule, planned breaks, and unscheduled hours available for catch-up production | Record on capital worksheet |
| Stoppage duration and reason log | Unplanned equipment failures separated from operator-cleared minor stops and planned setups | Record on capital worksheet |
| Bottleneck lost output count | Net good units permanently lost during constraint stops that cannot be recovered on overtime | Record on capital worksheet |
| Unit contribution margin basis | Finance-verified unit selling price less direct material, packaging film, and variable line expenses | Record on capital worksheet |
| Startup and restart scrap tally | Defective units and packaging web discarded during post-stop thermal and mechanical stabilization | Record on capital worksheet |
| Overtime catch-up labor and utility log | Incremental overtime hours, wage premium agreements, and extra shift utility burn used to recover output | Record on capital worksheet |
| Expedited freight and delay charges | Documented rush shipping expenses or contractual delivery penalties tied to line stoppages | Record on capital worksheet |
| Equipment RFP reliability targets | Target uptime, failure spacing, repair duration, jam ceiling, and remote diagnostic capabilities | Record on capital worksheet |
| Service response and acceptance criteria | Remote support response tier, field technician dispatch window, and factory trial pass criteria | Record on capital worksheet |
| Tiered critical spare parts list | On-site wear kits and long-lead custom components priced with the initial equipment quotation | Record on capital worksheet |
Sources
- National Institute of Standards and Technology (NIST) — Costs and Benefits of Maintenance in Manufacturing
- Viking Masek — The True Cost of Downtime: Strategies for Reliable Automation
- Viking Masek — What Packaging Equipment Downtime Really Costs, and How to Minimize It
- Wolf Packing — Minimizing Packaging Machine Downtime: Maintenance and Monitoring Tips
- Spack Machine — Bag Machine Maintenance: Daily Checklist to Prevent Downtime
- National Institute of Standards and Technology (NIST) — Selecting Optimal Data for Creating Informed Maintenance Decisions in a Manufacturing Environment
- Vorne Industries (OEE.com) — Hidden Factory
- Wolf Packing — Flow Wrap Machine Speeds: Matching Output to Upstream Equipment
- Syntegon — Future-Proof Automation in Food Packaging
- Ruida Packing — Overall Equipment Effectiveness in Pharmaceutical Manufacturing and Packaging
- Syntegon — Increasing OEE with Technical Audits
- PMMI Business Intelligence — Quickie Survey: Overall Equipment Effectiveness (OEE) Results Final Report
- Lean Enterprise Institute — Overall Equipment Effectiveness (OEE)
- Vorne Industries (OEE.com) — OEE Six Big Losses
- The Lean Suite — Six Big Losses That Reduce OEE in Manufacturing
- Lean Enterprise Institute — Changeover
- Lean Enterprise Institute — Single Minute Exchange of Die (SMED)
- Flexographic Technical Association (FTA) — Overall Equipment Effectiveness in Manufacturing
- U.S. Department of Labor (US DOL) — Wages and the Fair Labor Standards Act (FLSA)
- U.S. Department of Labor (US DOL) — Weekend or Night Work (FLSA Advisor)
- Vorne Industries (OEE.com) — TEEP (Total Effective Equipment Performance)
- Federal Reserve Board — Capacity Utilization Explanatory Notes
- U.S. Census Bureau — Quarterly Survey of Plant Capacity Utilization (QPC) Methodology
- NIST/SEMATECH e-Handbook of Statistical Methods — Homogeneous Poisson Process (HPP)
- NIST MEP National Network — How to Plan for Successful Automation Implementation
- Kenwei — Reliability Metrics for Multihead Weigher Purchases
- OpenStax Principles of Finance — Net Present Value (NPV) Method